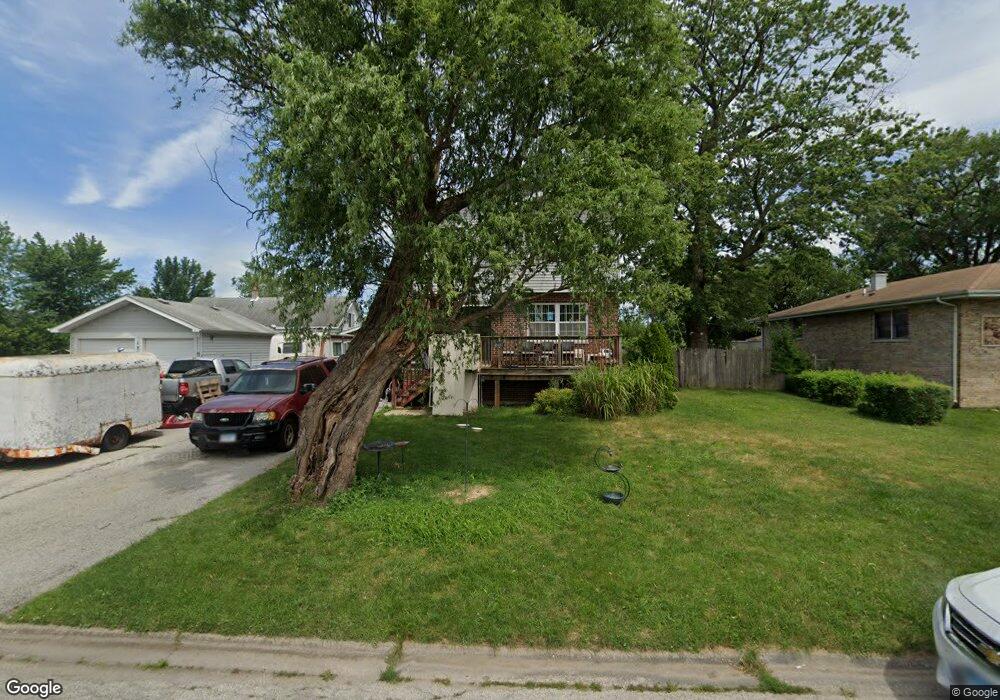
15137 Irving Ave Dolton, IL 60419
Estimated Value: $228,000 - $304,000
6
Beds
2
Baths
2,295
Sq Ft
$116/Sq Ft
Est. Value
About This Home
This home is located at 15137 Irving Ave, Dolton, IL 60419 and is currently estimated at $267,141, approximately $116 per square foot. 15137 Irving Ave is a home located in Cook County with nearby schools including Diekman Elementary School, Carol Moseley Braun School, and Creative Communications Academy.
Ownership History
Date
Name
Owned For
Owner Type
Purchase Details
Closed on
Aug 1, 2007
Sold by
Deutsche Bank National Trust Co
Bought by
Reeves Eddie and Reeves Henry
Current Estimated Value
Home Financials for this Owner
Home Financials are based on the most recent Mortgage that was taken out on this home.
Original Mortgage
$119,700
Interest Rate
6.55%
Mortgage Type
Unknown
Purchase Details
Closed on
Mar 5, 2007
Sold by
Harris Sir James F
Bought by
Deutsche Bank National Trust Co and Morgan Stanley Abs Capital I Inc Trust 2
Purchase Details
Closed on
Mar 17, 2004
Sold by
Opyt Joseph C and Opyt Mary Jane
Bought by
Harris Sir James F
Home Financials for this Owner
Home Financials are based on the most recent Mortgage that was taken out on this home.
Original Mortgage
$109,650
Interest Rate
8.5%
Mortgage Type
Unknown
Create a Home Valuation Report for This Property
The Home Valuation Report is an in-depth analysis detailing your home's value as well as a comparison with similar homes in the area
Home Values in the Area
Average Home Value in this Area
Purchase History
| Date | Buyer | Sale Price | Title Company |
|---|---|---|---|
| Reeves Eddie | $133,000 | Ticor Title | |
| Reeves Eddie | -- | Ticor Title | |
| Deutsche Bank National Trust Co | -- | None Available | |
| Harris Sir James F | $129,000 | Pntn |
Source: Public Records
Mortgage History
| Date | Status | Borrower | Loan Amount |
|---|---|---|---|
| Previous Owner | Reeves Eddie | $119,700 | |
| Previous Owner | Harris Sir James F | $109,650 |
Source: Public Records
Tax History Compared to Growth
Tax History
| Year | Tax Paid | Tax Assessment Tax Assessment Total Assessment is a certain percentage of the fair market value that is determined by local assessors to be the total taxable value of land and additions on the property. | Land | Improvement |
|---|---|---|---|---|
| 2024 | $2,164 | $26,000 | $4,420 | $21,580 |
| 2023 | $8,832 | $26,000 | $4,420 | $21,580 |
| 2022 | $8,832 | $18,357 | $3,900 | $14,457 |
| 2021 | $8,514 | $18,357 | $3,900 | $14,457 |
| 2020 | $8,217 | $18,357 | $3,900 | $14,457 |
| 2019 | $8,028 | $17,181 | $3,640 | $13,541 |
| 2018 | $12,476 | $17,181 | $3,640 | $13,541 |
| 2017 | $11,805 | $17,181 | $3,640 | $13,541 |
| 2016 | $13,773 | $21,604 | $3,380 | $18,224 |
| 2015 | $10,534 | $21,604 | $3,380 | $18,224 |
| 2014 | $13,137 | $21,604 | $3,380 | $18,224 |
| 2013 | $7,985 | $14,000 | $3,380 | $10,620 |
Source: Public Records
Map
Nearby Homes
- 15041 Irving Ave
- 15037 Irving Ave
- 15221 Oak St
- 15019 Oak St
- 15237 Oak St
- 15019 Evers St
- 619 E 152nd St
- 14930 Irving Ave
- 14915 Irving Ave
- 15223 Cottage Grove Ave
- 15320 Evers St
- 15304 Grant St
- 14900 Oak St
- 14915 Grant St
- 14838 Champlain St
- 14900 Evers St
- 14841 Langley Ave
- 717 E 154th St
- 14828 Oak St
- 749 E 154th St
- 15139 Irving Ave
- 15115 Irving Ave
- 15143 Irving Ave
- 15113 Irving Ave
- 15132 Champlain Ave
- 15130 Champlain Ave
- 15128 Champlain Ave
- 15134 Champlain Ave
- 15122 Champlain Ave
- 15140 Champlain Ave
- 15111 Irving Ave
- 694 E 152nd St
- 694 E 152nd St
- 15130 Irving Ave
- 15134 Irving Ave
- 15126 Irving Ave
- 15118 Champlain Ave
- 15144 Champlain Ave
- 15124 Irving Ave
- 15124 Irving Ave