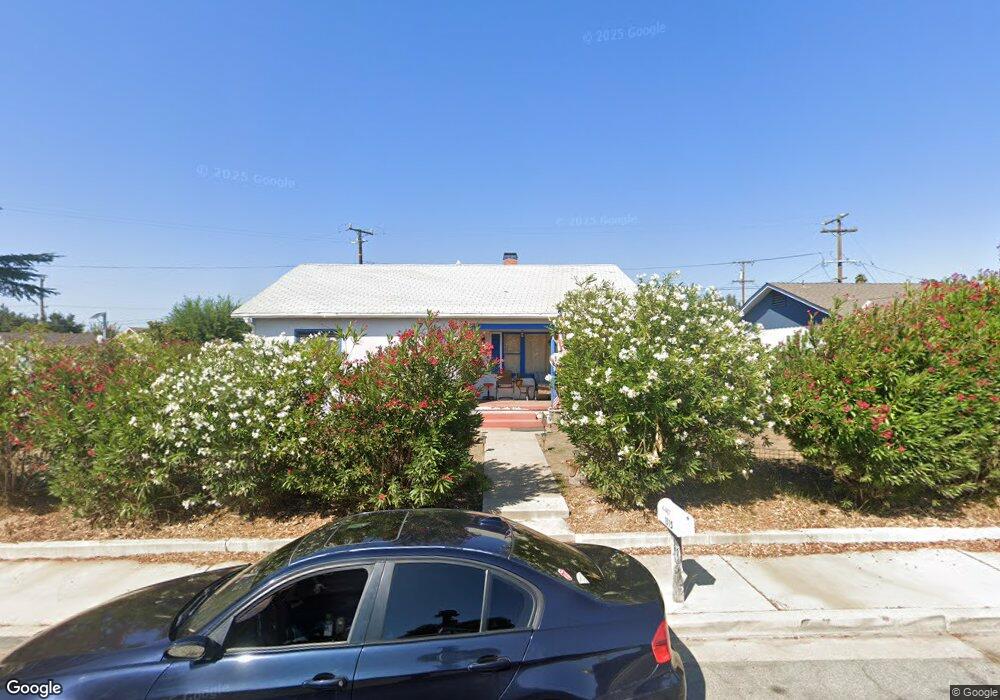
1515 Elm Ave Solvang, CA 93463
Estimated Value: $963,000 - $1,333,000
3
Beds
2
Baths
1,404
Sq Ft
$811/Sq Ft
Est. Value
About This Home
This home is located at 1515 Elm Ave, Solvang, CA 93463 and is currently estimated at $1,138,291, approximately $810 per square foot. 1515 Elm Ave is a home located in Santa Barbara County with nearby schools including Solvang Elementary School, Santa Ynez Valley Union High School, and Olive Grove Charter - Buellton.
Ownership History
Date
Name
Owned For
Owner Type
Purchase Details
Closed on
Feb 4, 2020
Sold by
Nocas Elizabeth R and Joyce Nocas 2018 Irrevocable T
Bought by
Nocas Elizabeth R
Current Estimated Value
Purchase Details
Closed on
Oct 15, 2018
Sold by
Nocas Joyce and Nocas Joyce
Bought by
Nocas Eluizabeth R and Joyce Nocas 2018 Irrevocable T
Purchase Details
Closed on
Sep 17, 2018
Sold by
Nocas Joyce and Joyce Nocas Family Trust
Bought by
Nocas Joyce and Nocas Elizabeth R
Purchase Details
Closed on
Dec 2, 2016
Sold by
Nocas Matthew
Bought by
Nocas Joyce
Purchase Details
Closed on
Sep 27, 2016
Sold by
Nocas Matthew
Bought by
Nocas Joyce
Purchase Details
Closed on
Dec 5, 2014
Sold by
Nocas Joyce
Bought by
Nocas Matthew
Purchase Details
Closed on
Sep 14, 2005
Sold by
Nocas Joyce Breaux
Bought by
Nocas Joyce
Create a Home Valuation Report for This Property
The Home Valuation Report is an in-depth analysis detailing your home's value as well as a comparison with similar homes in the area
Home Values in the Area
Average Home Value in this Area
Purchase History
| Date | Buyer | Sale Price | Title Company |
|---|---|---|---|
| Nocas Elizabeth R | -- | None Available | |
| Nocas Eluizabeth R | -- | None Available | |
| Nocas Joyce | -- | None Available | |
| Nocas Joyce | -- | None Available | |
| Nocas Matthew | -- | None Available | |
| Nocas Joyce | -- | None Available | |
| Nocas Matthew | -- | None Available | |
| Nocas Joyce | -- | -- |
Source: Public Records
Tax History Compared to Growth
Tax History
| Year | Tax Paid | Tax Assessment Tax Assessment Total Assessment is a certain percentage of the fair market value that is determined by local assessors to be the total taxable value of land and additions on the property. | Land | Improvement |
|---|---|---|---|---|
| 2025 | $3,958 | $370,497 | $218,316 | $152,181 |
| 2023 | $3,958 | $356,113 | $209,840 | $146,273 |
| 2022 | $3,831 | $349,131 | $205,726 | $143,405 |
| 2021 | $3,775 | $342,287 | $201,693 | $140,594 |
| 2020 | $3,718 | $338,778 | $199,625 | $139,153 |
| 2019 | $2,252 | $213,561 | $92,852 | $120,709 |
| 2018 | $2,213 | $209,375 | $91,032 | $118,343 |
| 2017 | $2,175 | $205,271 | $89,248 | $116,023 |
| 2016 | $2,099 | $201,248 | $87,499 | $113,749 |
| 2014 | $1,976 | $194,344 | $84,497 | $109,847 |
Source: Public Records
Map
Nearby Homes