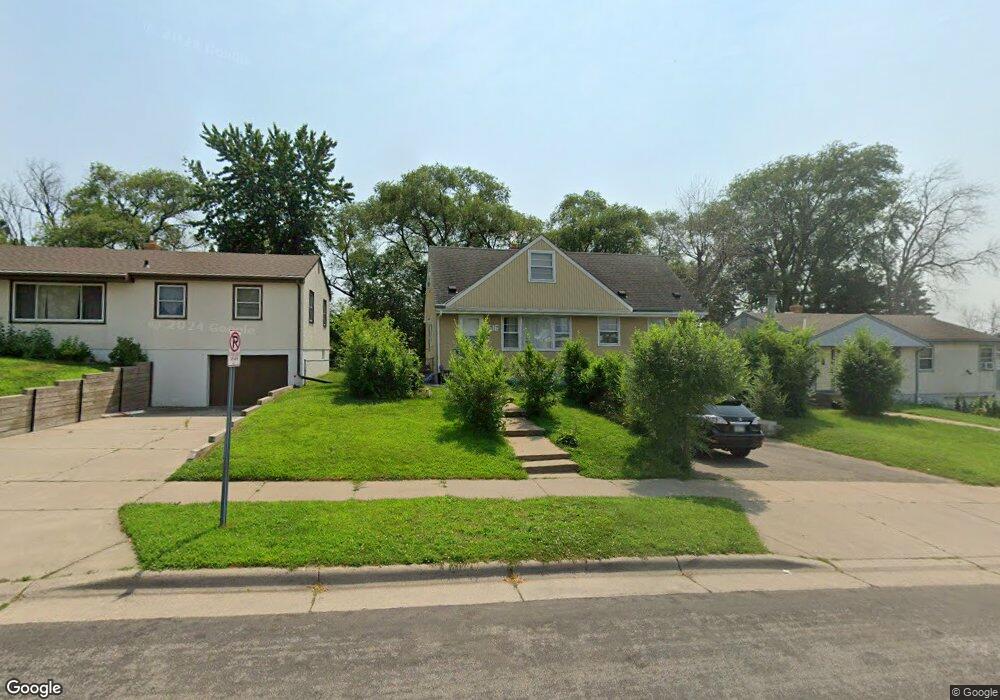
1516 1516 Fremont-Avenue- St. Paul, MN 55106
Battle Creek NeighborhoodEstimated Value: $248,000 - $281,000
4
Beds
1
Bath
1,019
Sq Ft
$262/Sq Ft
Est. Value
About This Home
This home is located at 1516 1516 Fremont-Avenue-, St. Paul, MN 55106 and is currently estimated at $267,168, approximately $262 per square foot. 1516 1516 Fremont-Avenue- is a home located in Ramsey County with nearby schools including Eastern Heights Elementary School, Battle Creek Middle School, and Harding Senior High School.
Ownership History
Date
Name
Owned For
Owner Type
Purchase Details
Closed on
Mar 21, 2023
Sold by
Johnny Jaw and Johnny Mukee
Bought by
Zaw Chachris and Kyaw Kher
Current Estimated Value
Home Financials for this Owner
Home Financials are based on the most recent Mortgage that was taken out on this home.
Original Mortgage
$210,370
Outstanding Balance
$203,718
Interest Rate
6.09%
Mortgage Type
New Conventional
Estimated Equity
$63,450
Purchase Details
Closed on
Dec 13, 2018
Sold by
Higgins Her Zeng C and Higgins Her Bridget Pauline
Bought by
Jaw Johnny
Home Financials for this Owner
Home Financials are based on the most recent Mortgage that was taken out on this home.
Original Mortgage
$169,569
Interest Rate
4.8%
Mortgage Type
VA
Purchase Details
Closed on
Jul 22, 2009
Sold by
Deutsche Bank National Trust Company
Bought by
Aurora Resources Llc
Purchase Details
Closed on
Nov 28, 2000
Sold by
Carty Howard L and Carty Gloria J
Bought by
Konobeck Robert W and Konobeck Leane
Create a Home Valuation Report for This Property
The Home Valuation Report is an in-depth analysis detailing your home's value as well as a comparison with similar homes in the area
Home Values in the Area
Average Home Value in this Area
Purchase History
| Date | Buyer | Sale Price | Title Company |
|---|---|---|---|
| Zaw Chachris | $218,000 | -- | |
| Jaw Johnny | $168,000 | Liberty Title Inc | |
| Aurora Resources Llc | $79,900 | -- | |
| Konobeck Robert W | $100,000 | -- |
Source: Public Records
Mortgage History
| Date | Status | Borrower | Loan Amount |
|---|---|---|---|
| Open | Zaw Chachris | $210,370 | |
| Previous Owner | Jaw Johnny | $169,569 |
Source: Public Records
Tax History Compared to Growth
Tax History
| Year | Tax Paid | Tax Assessment Tax Assessment Total Assessment is a certain percentage of the fair market value that is determined by local assessors to be the total taxable value of land and additions on the property. | Land | Improvement |
|---|---|---|---|---|
| 2025 | $3,714 | $248,000 | $40,500 | $207,500 |
| 2024 | $3,714 | $243,700 | $40,500 | $203,200 |
| 2023 | $3,714 | $248,800 | $25,200 | $223,600 |
| 2022 | $3,190 | $244,100 | $25,200 | $218,900 |
| 2021 | $2,560 | $200,800 | $25,200 | $175,600 |
| 2020 | $2,406 | $179,000 | $25,200 | $153,800 |
| 2019 | $2,552 | $160,100 | $25,200 | $134,900 |
| 2018 | $2,340 | $157,300 | $25,200 | $132,100 |
| 2017 | $2,384 | $151,500 | $25,200 | $126,300 |
| 2016 | $2,080 | $0 | $0 | $0 |
| 2015 | $2,096 | $127,100 | $25,200 | $101,900 |
| 2014 | $1,180 | $0 | $0 | $0 |
Source: Public Records
Map
Nearby Homes
- 1450 Fremont Ave
- 1538 Wilson Ave
- 1489 6th St E
- 1600 Old Hudson Rd
- 1685 Fremont Ave
- 1551 Margaret St
- 1493 Margaret St
- 1351 3rd St E
- 1443 Pacific St
- 1590 Minnehaha Ave E
- 1303 Fremont Ave
- 1320 Wilson Ave
- 267 Hazelwood St
- 1356 Beech St
- 1333 Pacific St
- 1365 Beech St
- 1269 Wilson Ave
- 1257 Wilson Ave
- 1675 Minnehaha Ave E
- 1367 Minnehaha Ave E
- 1516 Fremont Ave
- 1510 Fremont Ave
- 1522 Fremont Ave
- 1528 Fremont Ave
- 1511 3rd St E
- 1517 3rd St E
- 1505 3rd St E
- 1523 3rd St E
- 1523 1523 3rd-Street-e
- 1523 1523 3rd St E
- 1498 Fremont Ave
- 537 Hazelwood St
- 1499 3rd St E
- 1529 3rd St E
- 1495 3rd St E
- 1492 Fremont Ave
- 1535 3rd St E
- 1491 3rd St E
- 1491 1491 3rd St E
- 1495 1495 3rd-Street-e