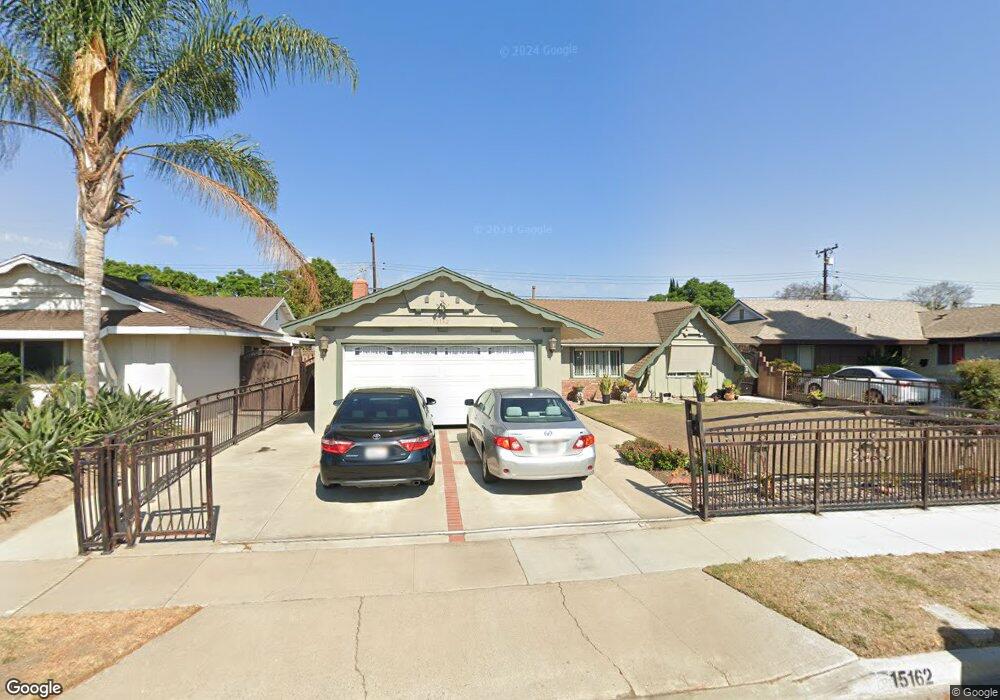
15162 Yawl St Garden Grove, CA 92843
Star View NeighborhoodEstimated Value: $1,047,000 - $1,296,000
4
Beds
2
Baths
1,594
Sq Ft
$724/Sq Ft
Est. Value
About This Home
This home is located at 15162 Yawl St, Garden Grove, CA 92843 and is currently estimated at $1,153,845, approximately $723 per square foot. 15162 Yawl St is a home located in Orange County with nearby schools including Susan B. Anthony Elementary School, McGarvin Intermediate School, and La Quinta High School.
Ownership History
Date
Name
Owned For
Owner Type
Purchase Details
Closed on
Apr 28, 2015
Sold by
Ngo Dang Luong Trong
Bought by
Ngo Dang Luong Trong and Dang Luong Trong Ngo Trust
Current Estimated Value
Purchase Details
Closed on
Jul 1, 2003
Sold by
Ngo Dang L T and Ngo Lam Quynh
Bought by
Ngo Dang Luong Trong
Home Financials for this Owner
Home Financials are based on the most recent Mortgage that was taken out on this home.
Original Mortgage
$160,000
Interest Rate
5.22%
Mortgage Type
Purchase Money Mortgage
Purchase Details
Closed on
Sep 11, 2001
Sold by
Choi Ming Tak and Choi Jessica
Bought by
Ngo Dang L T and Ngo Lam Quynh
Home Financials for this Owner
Home Financials are based on the most recent Mortgage that was taken out on this home.
Original Mortgage
$160,000
Interest Rate
6.88%
Purchase Details
Closed on
Dec 15, 1993
Sold by
Thai Anh Hue
Bought by
Choi Ming Tak and Thai Phung Kim
Create a Home Valuation Report for This Property
The Home Valuation Report is an in-depth analysis detailing your home's value as well as a comparison with similar homes in the area
Home Values in the Area
Average Home Value in this Area
Purchase History
| Date | Buyer | Sale Price | Title Company |
|---|---|---|---|
| Ngo Dang Luong Trong | -- | None Available | |
| Ngo Dang Luong Trong | -- | Fidelity National Title Co | |
| Ngo Dang L T | $200,000 | Southland Title | |
| Choi Ming Tak | -- | -- |
Source: Public Records
Mortgage History
| Date | Status | Borrower | Loan Amount |
|---|---|---|---|
| Closed | Ngo Dang Luong Trong | $160,000 | |
| Closed | Ngo Dang L T | $160,000 |
Source: Public Records
Tax History Compared to Growth
Tax History
| Year | Tax Paid | Tax Assessment Tax Assessment Total Assessment is a certain percentage of the fair market value that is determined by local assessors to be the total taxable value of land and additions on the property. | Land | Improvement |
|---|---|---|---|---|
| 2025 | $5,466 | $413,633 | $301,659 | $111,974 |
| 2024 | $5,466 | $405,523 | $295,744 | $109,779 |
| 2023 | $5,354 | $397,572 | $289,945 | $107,627 |
| 2022 | $5,228 | $389,777 | $284,260 | $105,517 |
| 2021 | $5,169 | $382,135 | $278,686 | $103,449 |
| 2020 | $5,101 | $378,217 | $275,828 | $102,389 |
| 2019 | $4,967 | $370,801 | $270,419 | $100,382 |
| 2018 | $4,864 | $363,531 | $265,117 | $98,414 |
| 2017 | $4,791 | $356,403 | $259,918 | $96,485 |
| 2016 | $4,562 | $349,415 | $254,821 | $94,594 |
| 2015 | $4,494 | $344,167 | $250,993 | $93,174 |
| 2014 | -- | $337,426 | $246,077 | $91,349 |
Source: Public Records
Map
Nearby Homes
- 10632 Henderson Ave
- 10562 Davit Ave
- 5405 W 4th St
- 5112 W 1st St Unit C
- 507 S Euclid St Unit 71
- 5114 W 1st St Unit C
- 5317 Silver Dr
- 323 N Euclid St Unit 99
- 4832 W 5th St Unit B
- 10744 Lehnhardt Ave
- 15890 Camo Bluff Ct
- 9936 Pear Dr
- 14356 Taft St
- 4518 W 1st St
- 4512 W Watkins Way
- 13322 Euclid St
- 901 S Harmon St
- 9851 Bolsa Ave Unit 198
- 9851 Bolsa Ave Unit 196
- 5010 W Maurie Ave