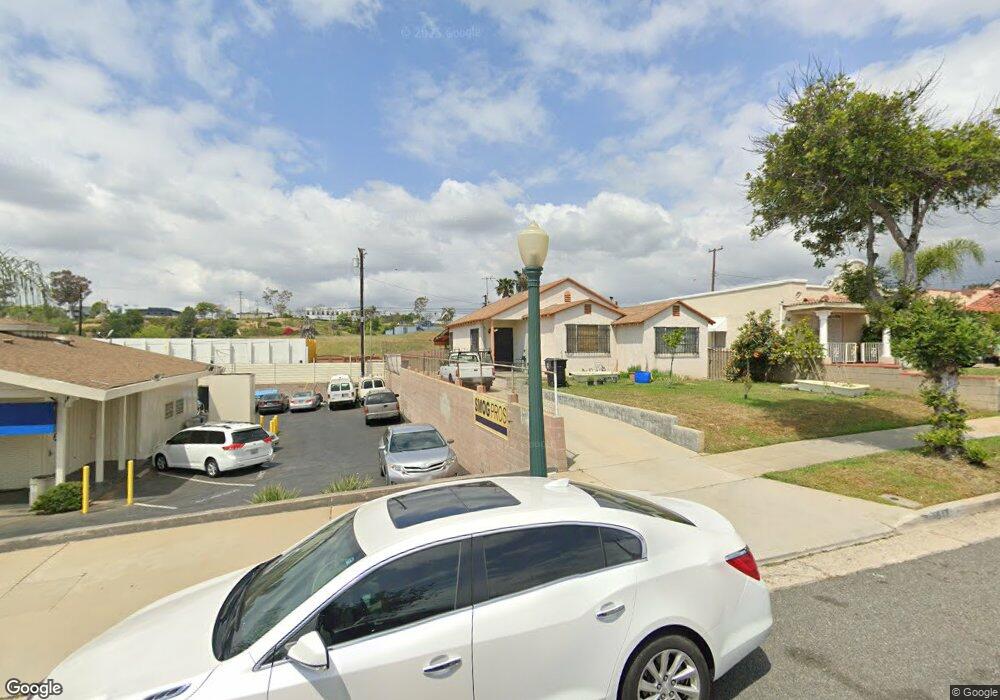
1517 Westmont Dr Alhambra, CA 91803
Alhambra Hills NeighborhoodEstimated Value: $807,124 - $974,000
3
Beds
1
Bath
1,088
Sq Ft
$811/Sq Ft
Est. Value
About This Home
This home is located at 1517 Westmont Dr, Alhambra, CA 91803 and is currently estimated at $882,531, approximately $811 per square foot. 1517 Westmont Dr is a home located in Los Angeles County with nearby schools including Fremont Elementary School, Alhambra High School, and St. Thomas More Catholic Elementary School.
Ownership History
Date
Name
Owned For
Owner Type
Purchase Details
Closed on
Sep 4, 2024
Sold by
Wu Kin Chong and Wu Yuen Kam
Bought by
Wu Yuan Kam
Current Estimated Value
Home Financials for this Owner
Home Financials are based on the most recent Mortgage that was taken out on this home.
Original Mortgage
$100,000
Outstanding Balance
$98,838
Interest Rate
6.73%
Mortgage Type
Credit Line Revolving
Estimated Equity
$783,693
Purchase Details
Closed on
Jul 31, 2024
Sold by
Yu Yong Cheng
Bought by
Wu Yuan Kam
Home Financials for this Owner
Home Financials are based on the most recent Mortgage that was taken out on this home.
Original Mortgage
$100,000
Outstanding Balance
$98,838
Interest Rate
6.73%
Mortgage Type
Credit Line Revolving
Estimated Equity
$783,693
Purchase Details
Closed on
Dec 22, 2012
Sold by
Wu Ken
Bought by
Wu Yuan Kam
Purchase Details
Closed on
Jun 14, 2011
Sold by
Wu Ken and Wu Yuan Kam
Bought by
Wu Ken and Wu Yuan Kam
Purchase Details
Closed on
Jun 3, 2002
Sold by
Wu Bong Keung and Wu Mei Kiu
Bought by
Wu Kin Chong
Create a Home Valuation Report for This Property
The Home Valuation Report is an in-depth analysis detailing your home's value as well as a comparison with similar homes in the area
Home Values in the Area
Average Home Value in this Area
Purchase History
| Date | Buyer | Sale Price | Title Company |
|---|---|---|---|
| Wu Yuan Kam | -- | Chicago Title Company | |
| Wu Yuan Kam | -- | Chicago Title Company | |
| Wu Yuan Kam | -- | None Available | |
| Wu Ken | -- | None Available | |
| Wu Kin Chong | -- | -- |
Source: Public Records
Mortgage History
| Date | Status | Borrower | Loan Amount |
|---|---|---|---|
| Open | Wu Yuan Kam | $100,000 |
Source: Public Records
Tax History Compared to Growth
Tax History
| Year | Tax Paid | Tax Assessment Tax Assessment Total Assessment is a certain percentage of the fair market value that is determined by local assessors to be the total taxable value of land and additions on the property. | Land | Improvement |
|---|---|---|---|---|
| 2025 | $5,342 | $424,147 | $340,432 | $83,715 |
| 2024 | $5,342 | $415,831 | $333,757 | $82,074 |
| 2023 | $5,298 | $407,678 | $327,213 | $80,465 |
| 2022 | $5,050 | $399,686 | $320,798 | $78,888 |
| 2021 | $4,997 | $391,850 | $314,508 | $77,342 |
| 2019 | $4,825 | $380,230 | $305,181 | $75,049 |
| 2018 | $4,781 | $372,776 | $299,198 | $73,578 |
| 2016 | $4,400 | $358,303 | $287,581 | $70,722 |
| 2015 | $4,334 | $352,922 | $283,262 | $69,660 |
| 2014 | $4,282 | $346,010 | $277,714 | $68,296 |
Source: Public Records
Map
Nearby Homes
- 1417 Milton Ave
- 2334 Highbury Ave
- 3008 Parkview Dr
- 2325 Highbury Ave Unit 59
- 2273 Highbury Ave
- 2901 Front St
- 2912 Covina St
- 1937 Charnwood Ave
- 2323 Warwick Ave
- 3123 Stockbridge Ave
- 2917 W Hellman Ave
- 1705 S Fremont Ave
- 2912 W Hellman Ave
- 5306 Borland Rd
- 5436 Norwich Ave
- 3233 Dorchester Ave
- 3202 Farnsworth Ave
- 5437 Norwich Ave
- 2000 La Paloma Ave
- 5274 Ithaca Ave
- 1515 Westmont Dr
- 1509 Westmont Dr
- 1505 Westmont Dr
- 1501 Westmont Dr
- 1504 Westmont Dr
- 1500 Westmont Dr
- 1421 Westmont Dr
- 1417 Westmont Dr
- 1444 Milton Ave
- 1415 Westmont Dr
- 3047 W Valley Blvd
- 1436 Milton Ave
- 3072 W Valley Blvd
- 1409 Westmont Dr
- 3060 W Valley Blvd
- 3200 W Valley Blvd
- 3052 W Valley Blvd
- 3052 W Valley Blvd
- 1407 Westmont Dr
- 1432 Milton Ave