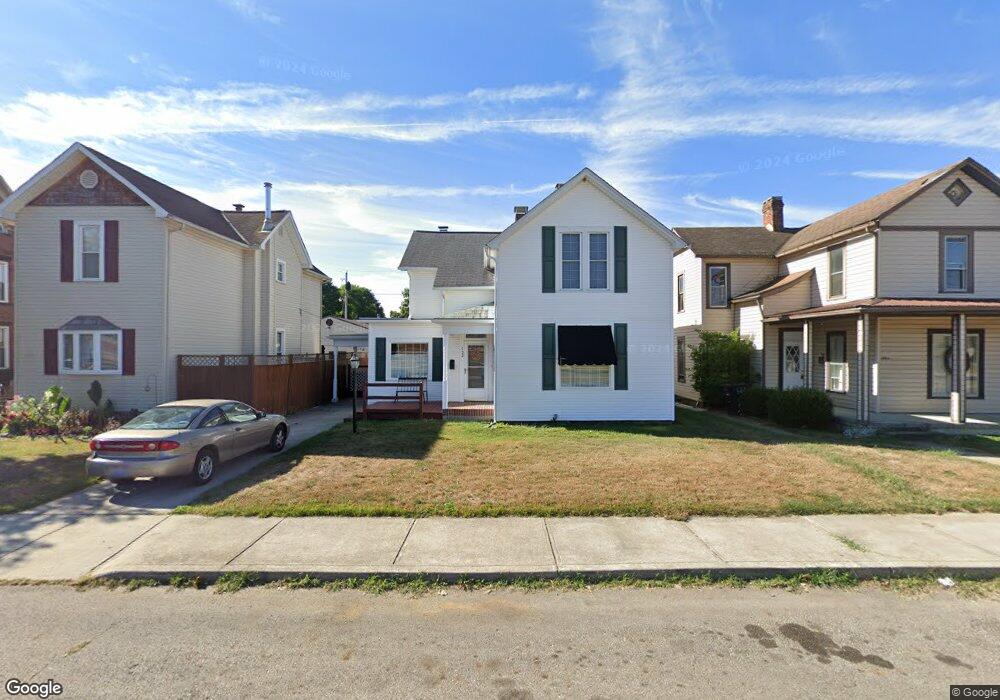
152 E Allen St Lancaster, OH 43130
Estimated Value: $258,457 - $377,000
3
Beds
2
Baths
1,922
Sq Ft
$157/Sq Ft
Est. Value
About This Home
This home is located at 152 E Allen St, Lancaster, OH 43130 and is currently estimated at $301,364, approximately $156 per square foot. 152 E Allen St is a home located in Fairfield County with nearby schools including Thomas Ewing Junior High School, Lancaster High School, and St Mary Elementary School.
Ownership History
Date
Name
Owned For
Owner Type
Purchase Details
Closed on
Jun 29, 2011
Sold by
Smith Nyla
Bought by
Clark Susan
Current Estimated Value
Home Financials for this Owner
Home Financials are based on the most recent Mortgage that was taken out on this home.
Original Mortgage
$103,920
Outstanding Balance
$70,602
Interest Rate
4.63%
Mortgage Type
New Conventional
Estimated Equity
$230,762
Purchase Details
Closed on
Nov 22, 2005
Sold by
Davis Donna M
Bought by
Smith Nyla
Home Financials for this Owner
Home Financials are based on the most recent Mortgage that was taken out on this home.
Original Mortgage
$123,500
Interest Rate
6.13%
Mortgage Type
Fannie Mae Freddie Mac
Purchase Details
Closed on
Dec 18, 2001
Sold by
Rochette John C
Bought by
Davis Donna M
Purchase Details
Closed on
Dec 20, 1991
Sold by
Durain Ruth M
Bought by
Rochotte John C
Create a Home Valuation Report for This Property
The Home Valuation Report is an in-depth analysis detailing your home's value as well as a comparison with similar homes in the area
Home Values in the Area
Average Home Value in this Area
Purchase History
| Date | Buyer | Sale Price | Title Company |
|---|---|---|---|
| Clark Susan | $129,900 | Valmer Land Title Agency | |
| Smith Nyla | $123,500 | Valmer Land Title Agency | |
| Davis Donna M | $97,500 | -- | |
| Rochotte John C | $47,500 | -- |
Source: Public Records
Mortgage History
| Date | Status | Borrower | Loan Amount |
|---|---|---|---|
| Open | Clark Susan | $103,920 | |
| Previous Owner | Smith Nyla | $123,500 |
Source: Public Records
Tax History
| Year | Tax Paid | Tax Assessment Tax Assessment Total Assessment is a certain percentage of the fair market value that is determined by local assessors to be the total taxable value of land and additions on the property. | Land | Improvement |
|---|---|---|---|---|
| 2025 | $5,414 | $86,280 | $14,390 | $71,890 |
| 2024 | $5,414 | $60,220 | $6,420 | $53,800 |
| 2023 | $1,858 | $60,220 | $6,420 | $53,800 |
| 2022 | $1,881 | $60,220 | $6,420 | $53,800 |
| 2021 | $1,486 | $46,840 | $6,420 | $40,420 |
| 2020 | $476 | $46,840 | $6,420 | $40,420 |
| 2019 | $1,354 | $46,840 | $6,420 | $40,420 |
| 2018 | $1,193 | $37,710 | $6,420 | $31,290 |
| 2017 | $1,194 | $40,640 | $3,820 | $36,820 |
| 2016 | $1,163 | $40,640 | $3,820 | $36,820 |
| 2015 | $1,103 | $38,100 | $3,820 | $34,280 |
| 2014 | $1,051 | $38,100 | $3,820 | $34,280 |
| 2013 | $1,051 | $38,100 | $3,820 | $34,280 |
Source: Public Records
Map
Nearby Homes
- 600 N High St
- 233 E 6th Ave
- 165 Lake St
- 820 N Broad St
- 123 Arnold Ave
- 311 E Allen St
- 526 N Columbus St
- 130 W Fair Ave
- 515 N Columbus St
- 517 N Maple St
- 233 Union St
- 249 N Pearl Ave
- 336 Reber Ave
- 0 Slocum Ave
- 154 E Main St
- 330 Park St
- 547 E Mulberry St
- 1156 Forest Rose Ave
- 534 E Wheeling St
- 641 King St
- 156 E Allen St
- 148 E Allen St
- 148 E Allen St Unit 148 1/2
- 144 E Allen St
- 160 E Allen St
- 164 E Allen St
- 140 E Allen St
- 168 E Allen St
- 136 E Allen St
- 153 E 6th Ave
- 149 E 6th Ave
- 159 E 6th Ave
- 145 E 6th Ave
- 174 E Allen St
- 132 E Allen St
- 163 E 6th Ave
- 173 E 6th Ave Unit A
- 173 E 6th Ave
- 167 E 6th Ave
- 128 E Allen St
Your Personal Tour Guide
Ask me questions while you tour the home.