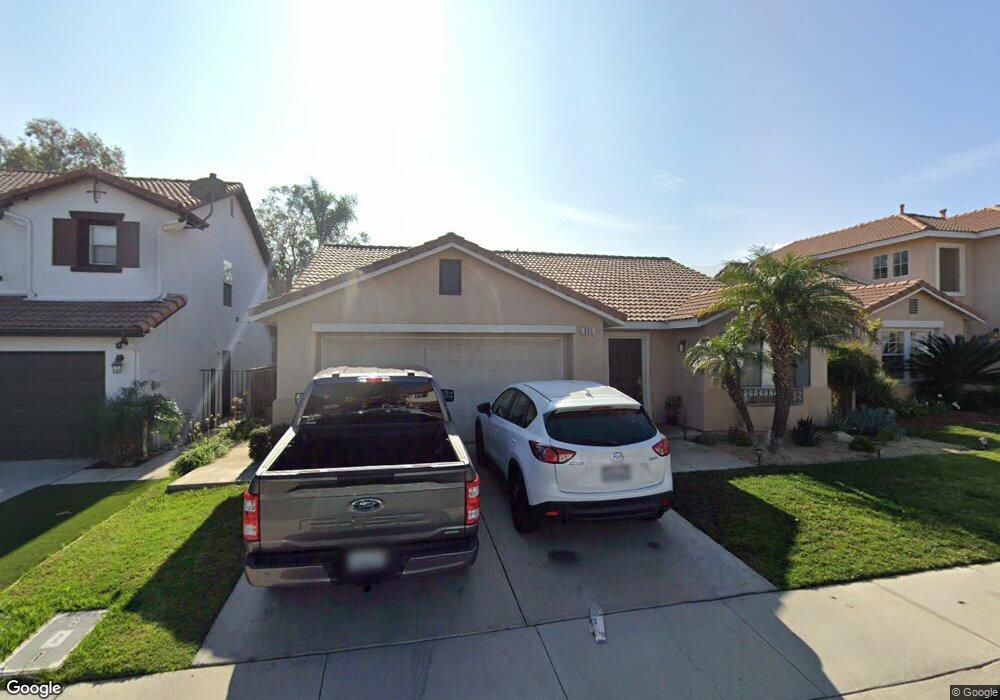
152 Hollyleaf Way Unit 38 Corona, CA 92881
South Corona NeighborhoodEstimated Value: $604,751 - $700,000
2
Beds
2
Baths
1,340
Sq Ft
$498/Sq Ft
Est. Value
About This Home
This home is located at 152 Hollyleaf Way Unit 38, Corona, CA 92881 and is currently estimated at $666,938, approximately $497 per square foot. 152 Hollyleaf Way Unit 38 is a home located in Riverside County with nearby schools including Dwight D. Eisenhower Elementary School, Citrus Hills Intermediate School, and Santiago High School.
Ownership History
Date
Name
Owned For
Owner Type
Purchase Details
Closed on
Nov 7, 2003
Sold by
Mangini Guy B
Bought by
Mangini Guy B and Mangini Trust
Current Estimated Value
Purchase Details
Closed on
Jul 17, 2003
Sold by
Mangini Guy B
Bought by
Mangini Guy B
Home Financials for this Owner
Home Financials are based on the most recent Mortgage that was taken out on this home.
Original Mortgage
$162,000
Outstanding Balance
$68,303
Interest Rate
5.15%
Mortgage Type
Purchase Money Mortgage
Estimated Equity
$598,635
Purchase Details
Closed on
Oct 7, 2002
Sold by
Mangini Guy B
Bought by
Mangini Guy B and Mangini Trust
Purchase Details
Closed on
Mar 9, 2001
Sold by
Kb Home Coastal Inc
Bought by
Mangini Guy B
Home Financials for this Owner
Home Financials are based on the most recent Mortgage that was taken out on this home.
Original Mortgage
$157,700
Interest Rate
7.21%
Create a Home Valuation Report for This Property
The Home Valuation Report is an in-depth analysis detailing your home's value as well as a comparison with similar homes in the area
Home Values in the Area
Average Home Value in this Area
Purchase History
| Date | Buyer | Sale Price | Title Company |
|---|---|---|---|
| Mangini Guy B | -- | -- | |
| Mangini Guy B | -- | Gateway Title Company | |
| Mangini Guy B | -- | -- | |
| Mangini Guy B | $197,500 | First American Title Co |
Source: Public Records
Mortgage History
| Date | Status | Borrower | Loan Amount |
|---|---|---|---|
| Open | Mangini Guy B | $162,000 | |
| Previous Owner | Mangini Guy B | $157,700 |
Source: Public Records
Tax History Compared to Growth
Tax History
| Year | Tax Paid | Tax Assessment Tax Assessment Total Assessment is a certain percentage of the fair market value that is determined by local assessors to be the total taxable value of land and additions on the property. | Land | Improvement |
|---|---|---|---|---|
| 2025 | $3,656 | $291,291 | $110,782 | $180,509 |
| 2023 | $3,656 | $279,981 | $106,481 | $173,500 |
| 2022 | $3,555 | $274,493 | $104,394 | $170,099 |
| 2021 | $3,493 | $269,112 | $102,348 | $166,764 |
| 2020 | $3,460 | $266,354 | $101,299 | $165,055 |
| 2019 | $3,630 | $261,132 | $99,313 | $161,819 |
| 2018 | $4,414 | $256,013 | $97,366 | $158,647 |
| 2017 | $4,337 | $250,994 | $95,457 | $155,537 |
| 2016 | $4,304 | $246,074 | $93,586 | $152,488 |
| 2015 | $4,250 | $242,380 | $92,181 | $150,199 |
| 2014 | $4,223 | $237,633 | $90,376 | $147,257 |
Source: Public Records
Map
Nearby Homes
- 3547 Hawthorne Dr
- 363 Appleby St
- 444 Appleby St
- 540 Newport Cir
- 197 Lydia Ln
- 479 Adirondack Dr
- 423 Cleveland Way
- 3720 Gunnison Cir Unit 18
- 651 Viewpointe Ln
- 3933 Malaga St
- 3100 Garretson Ave
- 4008 Crown Ranch Rd
- 4085 Strandberg St
- 795 Donatello Dr
- 848 Pointe Vista Cir Unit 14
- 4009 Cerveza Cir
- 3024 Sonrisa Dr
- 832 Carolina Cir
- 2885 Citrocado Ranch St
- 1078 Sunbeam Ln
- 142 Hollyleaf Way
- 162 Hollyleaf Way
- 132 Hollyleaf Way Unit 40
- 153 Hollyleaf Way
- 143 Hollyleaf Way Unit 109
- 163 Hollyleaf Way
- 122 Hollyleaf Way
- 133 Hollyleaf Way
- 182 Hollyleaf Way
- 3583 Hawthorne Dr Unit 34
- 112 Hollyleaf Way Unit 42
- 3583 Birchleaf Dr
- 130 Juneberry Cir
- 160 Juneberry Cir
- 190 Juneberry Cir
- 3569 Birchleaf Dr Unit 112
- 100 Juneberry Cir
- 165 E Orange Heights Ln
- 3559 Hawthorne Dr
- 102 Hollyleaf Way