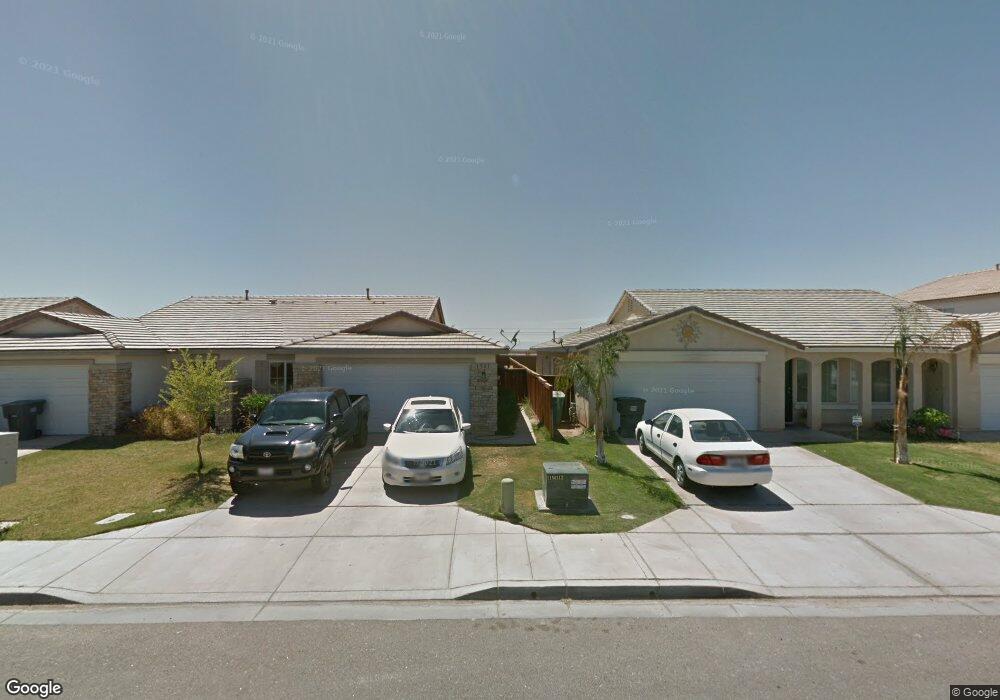
1521 Rodeo Dr Imperial, CA 92251
Estimated Value: $307,000 - $333,000
3
Beds
2
Baths
1,100
Sq Ft
$290/Sq Ft
Est. Value
About This Home
This home is located at 1521 Rodeo Dr, Imperial, CA 92251 and is currently estimated at $319,465, approximately $290 per square foot. 1521 Rodeo Dr is a home located in Imperial County with nearby schools including Ben Hulse Elementary School, Frank M. Wright Middle School, and Imperial High School.
Ownership History
Date
Name
Owned For
Owner Type
Purchase Details
Closed on
Oct 14, 2009
Sold by
Us Bank National Association
Bought by
Montes Maria J
Current Estimated Value
Home Financials for this Owner
Home Financials are based on the most recent Mortgage that was taken out on this home.
Original Mortgage
$70,695
Outstanding Balance
$45,570
Interest Rate
4.83%
Mortgage Type
FHA
Estimated Equity
$273,895
Purchase Details
Closed on
Dec 23, 2008
Sold by
Bedolla Jesus G
Bought by
Us Bank National Association and Banc Of America Funding Corporation Mort
Purchase Details
Closed on
Aug 2, 2006
Sold by
Bedolla Maria Imelda
Bought by
Bedolla Jesus G
Home Financials for this Owner
Home Financials are based on the most recent Mortgage that was taken out on this home.
Original Mortgage
$177,500
Interest Rate
7.37%
Mortgage Type
Purchase Money Mortgage
Create a Home Valuation Report for This Property
The Home Valuation Report is an in-depth analysis detailing your home's value as well as a comparison with similar homes in the area
Home Values in the Area
Average Home Value in this Area
Purchase History
| Date | Buyer | Sale Price | Title Company |
|---|---|---|---|
| Montes Maria J | $72,000 | First American Title Company | |
| Us Bank National Association | $125,000 | Accommodation | |
| Bedolla Jesus G | -- | Chicago Title Company | |
| Bedolla Jesus G | $222,000 | Chicago Title Company |
Source: Public Records
Mortgage History
| Date | Status | Borrower | Loan Amount |
|---|---|---|---|
| Open | Montes Maria J | $70,695 | |
| Previous Owner | Bedolla Jesus G | $177,500 | |
| Previous Owner | Bedolla Jesus G | $44,300 |
Source: Public Records
Tax History Compared to Growth
Tax History
| Year | Tax Paid | Tax Assessment Tax Assessment Total Assessment is a certain percentage of the fair market value that is determined by local assessors to be the total taxable value of land and additions on the property. | Land | Improvement |
|---|---|---|---|---|
| 2025 | $2,789 | $92,922 | $45,171 | $47,751 |
| 2023 | $2,789 | $89,316 | $43,418 | $45,898 |
| 2022 | $2,754 | $87,566 | $42,567 | $44,999 |
| 2021 | $2,709 | $85,850 | $41,733 | $44,117 |
| 2020 | $2,696 | $84,971 | $41,306 | $43,665 |
| 2019 | $2,670 | $83,306 | $40,497 | $42,809 |
| 2018 | $2,653 | $81,673 | $39,703 | $41,970 |
| 2017 | $2,567 | $80,073 | $38,925 | $41,148 |
| 2016 | $2,534 | $78,504 | $38,162 | $40,342 |
| 2015 | $2,576 | $77,326 | $37,589 | $39,737 |
| 2014 | $2,559 | $75,812 | $36,853 | $38,959 |
Source: Public Records
Map
Nearby Homes
- 1481 Rodeo Dr
- 468 Sorrel Ct
- 472 Palomino Ct
- 417 Vaquero Trail
- 477 Palomino Ct
- 1000 Rodeo Dr Unit 521
- 481 Palomino Ct
- 480 Palomino Ct
- 483 Palomino Ct
- Plan Two at Heritage at Dahlia Ranch
- Plan Four at Heritage at Dahlia Ranch
- Plan One at Heritage at Dahlia Ranch
- Plan Three at Heritage at Dahlia Ranch
- 485 Sorrel Ct
- 484 Palomino Ct
- 605 Dawn Ct
- 296 Winchester Ln
- 101 W 14th St Unit 105
- 220 W 14th St
- 621 N D St
- 1531 Rodeo Dr
- 1501 Rodeo Dr
- 1541 Rodeo Dr
- 1551 Rodeo Dr
- 1551 0 Rodeo Dr
- 140 Morongo Dr
- 1461 Rodeo Dr
- 141 Morongo Dr
- 1561 Rodeo Dr
- 150 Morongo Dr
- 1451 Rodeo Dr
- 141 Santa Rosa Dr
- 151 Morongo Dr
- 160 Morongo Dr
- 161 Morongo Dr
- 1441 Rodeo Dr
- 1601 Rodeo Dr
- 151 Santa Rosa Dr
- 170 Morongo Dr
- 150 Shoshonean Dr