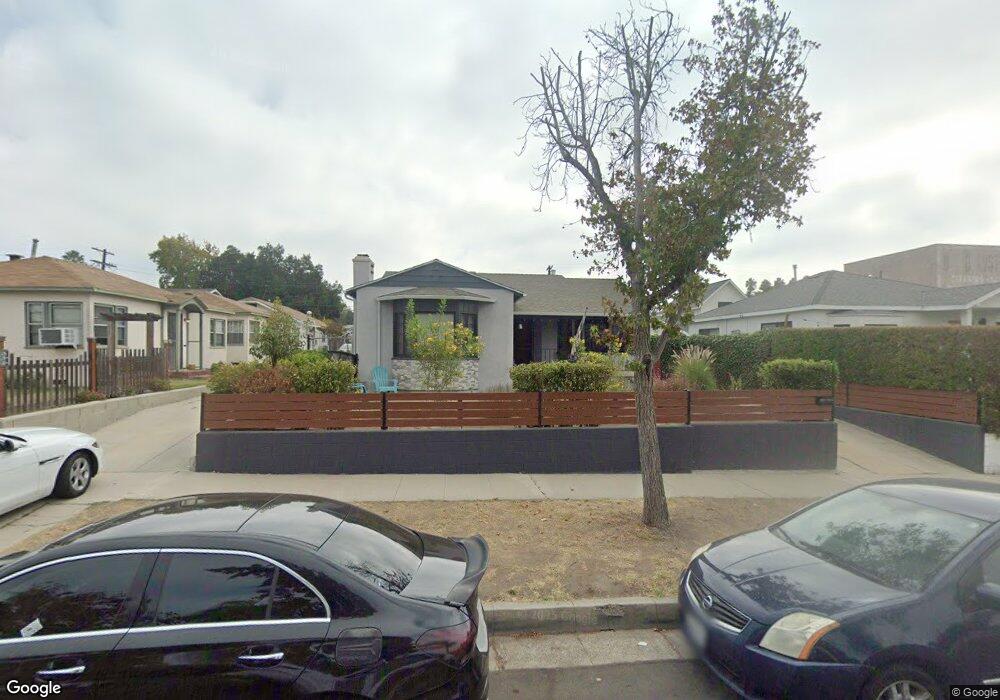
1522 Tonawanda Ave Los Angeles, CA 90041
Eagle Rock NeighborhoodEstimated Value: $1,160,000 - $1,708,000
4
Beds
4
Baths
2,610
Sq Ft
$556/Sq Ft
Est. Value
About This Home
This home is located at 1522 Tonawanda Ave, Los Angeles, CA 90041 and is currently estimated at $1,451,107, approximately $555 per square foot. 1522 Tonawanda Ave is a home located in Los Angeles County with nearby schools including Toland Way Elementary School, Eagle Rock High School, and Irving STEAM Magnet School.
Ownership History
Date
Name
Owned For
Owner Type
Purchase Details
Closed on
Feb 23, 1998
Sold by
Villa Agustin Rene G
Bought by
Pascua Maria Victoria S
Current Estimated Value
Home Financials for this Owner
Home Financials are based on the most recent Mortgage that was taken out on this home.
Original Mortgage
$166,145
Outstanding Balance
$29,386
Interest Rate
6.99%
Mortgage Type
FHA
Estimated Equity
$1,421,721
Purchase Details
Closed on
Feb 2, 1998
Sold by
Pascua Maria V
Bought by
Garay Cusberto and Lopez Faviola
Home Financials for this Owner
Home Financials are based on the most recent Mortgage that was taken out on this home.
Original Mortgage
$166,145
Outstanding Balance
$29,386
Interest Rate
6.99%
Mortgage Type
FHA
Estimated Equity
$1,421,721
Purchase Details
Closed on
Sep 18, 1995
Sold by
Pascua Arnel S
Bought by
Pascua Maria Victoria S and Pascua Arnedo S
Purchase Details
Closed on
Jul 18, 1995
Sold by
Pascua Alan S and Pascua Angeline D
Bought by
Pascua Maria Victoria S and Pascua Arnel S
Create a Home Valuation Report for This Property
The Home Valuation Report is an in-depth analysis detailing your home's value as well as a comparison with similar homes in the area
Home Values in the Area
Average Home Value in this Area
Purchase History
| Date | Buyer | Sale Price | Title Company |
|---|---|---|---|
| Pascua Maria Victoria S | -- | American Title Ins Co | |
| Pascua Arnedo S | -- | American Title Ins Co | |
| Garay Cusberto | $170,000 | -- | |
| Pascua Maria Victoria S | -- | Southland Title Corporation | |
| Pascua Maria Victoria S | -- | -- |
Source: Public Records
Mortgage History
| Date | Status | Borrower | Loan Amount |
|---|---|---|---|
| Open | Garay Cusberto | $166,145 |
Source: Public Records
Tax History Compared to Growth
Tax History
| Year | Tax Paid | Tax Assessment Tax Assessment Total Assessment is a certain percentage of the fair market value that is determined by local assessors to be the total taxable value of land and additions on the property. | Land | Improvement |
|---|---|---|---|---|
| 2025 | $4,123 | $323,534 | $191,600 | $131,934 |
| 2024 | $4,123 | $317,192 | $187,844 | $129,348 |
| 2023 | $4,048 | $310,973 | $184,161 | $126,812 |
| 2022 | $3,867 | $304,876 | $180,550 | $124,326 |
| 2021 | $3,805 | $298,899 | $177,010 | $121,889 |
| 2020 | $3,837 | $295,835 | $175,195 | $120,640 |
| 2019 | $3,694 | $290,035 | $171,760 | $118,275 |
| 2018 | $3,574 | $284,349 | $168,393 | $115,956 |
| 2016 | $3,387 | $273,309 | $161,855 | $111,454 |
| 2015 | $3,339 | $269,204 | $159,424 | $109,780 |
| 2014 | $3,361 | $263,932 | $156,302 | $107,630 |
Source: Public Records
Map
Nearby Homes
- 1607 Campus Rd
- 4666 York Blvd
- 1747 N Avenue 46
- 4654 Toland Way
- 4707 Toland Way
- 1745 College View Place
- 1553 Verbena Way
- 1336 Armadale Ave
- 4500 Mont Eagle Place
- 3832 W Avenue 43 Unit 5
- 2402 Langdale Ave
- 2161 Ridgeview Ave
- 2536 Medlow Ave
- 4263 Barryknoll Dr
- 4200 Toland Way
- 2633 Medlow Ave
- 4854 Buchanan St
- 4312 Division St
- 4780 Hub St
- 4824 Toland Way
- 1526 Tonawanda Ave
- 1518 Tonawanda Ave
- 1520 Tonawanda Ave
- 4557 York Blvd Unit 1
- 1532 Tonawanda Ave
- 1523 N Avenue 46
- 1538 Tonawanda Ave
- 1527 N Avenue 46
- 1519 N Avenue 46
- 1517 N Avenue 46
- 1533 N Avenue 46
- 1513 N Avenue 46
- 1542 Tonawanda Ave
- 1523 Tonawanda Ave
- 1535 N Avenue 46
- 1507 N Avenue 46
- 1519 Tonawanda Ave
- 1527 Tonawanda Ave
- 1531 Tonawanda Ave
- 1511 Tonawanda Ave