
Seller's Agent in 2024
William Hendry
southCoast Properties
(912) 925-9925
2 Total Sales
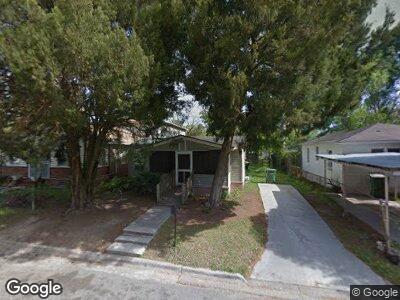
1524 Chester St Available November 21st for $1400
Fabulous 3 Bedroom, 2 Bath bungalow!
Super Great Access to Downtown Savannah, Hospitals, Shopping, and Restaurants!
New flooring throughout!
Updated bathrooms!
The kitchen has Refrigerator and Stove!
Fences yard!!
OFF-STREET PARKING!!
| Date | Buyer | Sale Price | Title Company |
|---|---|---|---|
| Dh1 Holding Llc | $56,000 | -- | |
| Pickett Dennis M | $8,000 | -- |
| Date | Status | Borrower | Loan Amount |
|---|---|---|---|
| Open | Dh1 Holding Llc | $769,000 | |
| Previous Owner | Vacation Trust Inc | $5,670 |
| Date | Event | Price | Change | Sq Ft Price |
|---|---|---|---|---|
| 10/09/2024 10/09/24 | Rented | $1,400 | 0.0% | -- |
| 10/08/2024 10/08/24 | For Rent | $1,400 | 0.0% | -- |
| 11/15/2023 11/15/23 | Rented | $1,400 | 0.0% | -- |
| 11/15/2023 11/15/23 | Price Changed | $1,400 | +21.2% | $1 / Sq Ft |
| 11/14/2023 11/14/23 | For Rent | $1,155 | +5.0% | -- |
| 09/15/2022 09/15/22 | Rented | $1,100 | 0.0% | -- |
| 09/09/2022 09/09/22 | For Rent | $1,100 | -4.3% | -- |
| 11/04/2021 11/04/21 | Rented | $1,150 | 0.0% | -- |
| 10/20/2021 10/20/21 | For Rent | $1,150 | 0.0% | -- |
| 06/19/2013 06/19/13 | Sold | $8,000 | -42.9% | $7 / Sq Ft |
| 06/12/2013 06/12/13 | Pending | -- | -- | -- |
| 10/16/2012 10/16/12 | For Sale | $14,000 | -- | $13 / Sq Ft |
| Year | Tax Paid | Tax Assessment Tax Assessment Total Assessment is a certain percentage of the fair market value that is determined by local assessors to be the total taxable value of land and additions on the property. | Land | Improvement |
|---|---|---|---|---|
| 2024 | $904 | $27,720 | $4,200 | $23,520 |
| 2023 | $295 | $24,200 | $1,200 | $23,000 |
| 2022 | $343 | $21,920 | $1,200 | $20,720 |
| 2021 | $490 | $11,120 | $1,200 | $9,920 |
| 2020 | $351 | $11,120 | $1,200 | $9,920 |
| 2019 | $668 | $11,120 | $1,200 | $9,920 |
| 2018 | $1,316 | $11,000 | $1,200 | $9,800 |
| 2017 | $1,345 | $12,800 | $4,040 | $8,760 |
| 2016 | $376 | $12,880 | $4,040 | $8,840 |
| 2015 | $564 | $13,520 | $4,040 | $9,480 |
| 2014 | $912 | $13,840 | $0 | $0 |
Seller's Agent in 2024
William Hendry
southCoast Properties
(912) 925-9925
2 Total Sales
Seller's Agent in 2021
ilonia mitchell
Scott Realty Professionals
(912) 660-5355
1 in this area
32 Total Sales
V
Seller's Agent in 2013
Vickie Linscott
Keller Williams Coastal Area P
Seller Co-Listing Agent in 2013
Christina McIntosh
McIntosh Realty Team LLC
(912) 272-3463
214 Total Sales
Buyer's Agent in 2013
Larry Allen
The Allen Real Estate Group
(912) 596-1378
5 in this area
42 Total Sales