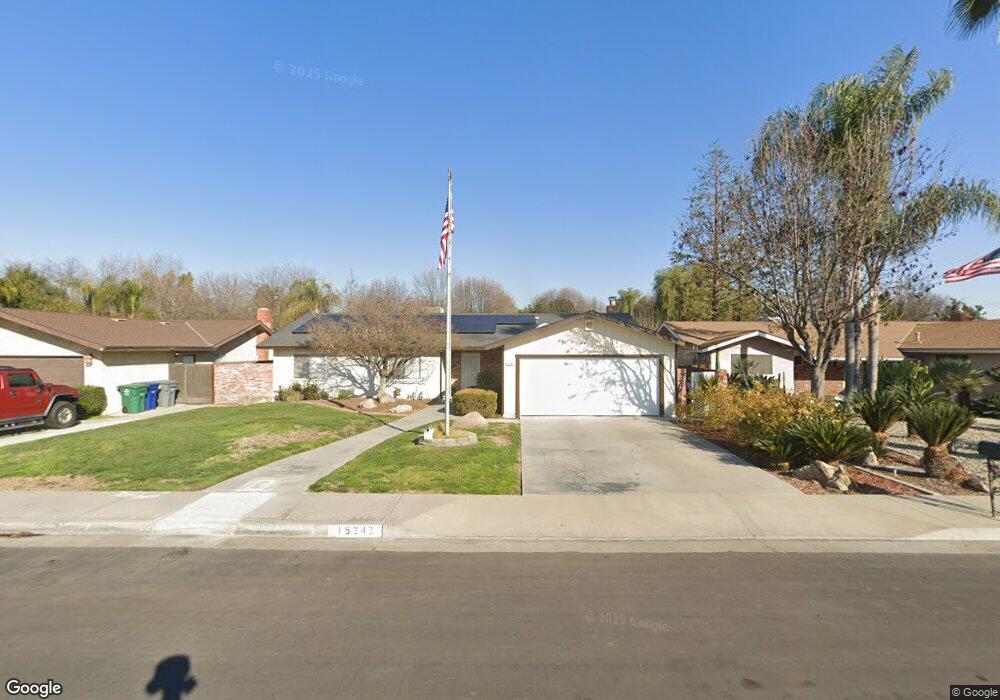
15242 W El Mar Ln Kerman, CA 93630
Estimated Value: $397,000 - $424,000
2
Beds
2
Baths
1,698
Sq Ft
$239/Sq Ft
Est. Value
About This Home
This home is located at 15242 W El Mar Ln, Kerman, CA 93630 and is currently estimated at $406,506, approximately $239 per square foot. 15242 W El Mar Ln is a home located in Fresno County with nearby schools including Kerman-Floyd Elementary School.
Ownership History
Date
Name
Owned For
Owner Type
Purchase Details
Closed on
Jan 9, 2009
Sold by
Gill Mary Therese Morrow
Bought by
Sarkisian Chad and Abundis Guadalupe
Current Estimated Value
Home Financials for this Owner
Home Financials are based on the most recent Mortgage that was taken out on this home.
Original Mortgage
$142,091
Interest Rate
5.03%
Mortgage Type
Purchase Money Mortgage
Purchase Details
Closed on
Oct 16, 2007
Sold by
Morrow Frank Ellsworth and Morrow Frank
Bought by
Morrow Frank Ellsworth
Purchase Details
Closed on
Oct 6, 1999
Sold by
Peter Williams
Bought by
Morrow Frank
Purchase Details
Closed on
Jan 26, 1994
Sold by
Stidham Paul Dean and Stidham Cathi Lynn
Bought by
Williams Peter and Williams Jan
Home Financials for this Owner
Home Financials are based on the most recent Mortgage that was taken out on this home.
Original Mortgage
$98,550
Interest Rate
7%
Create a Home Valuation Report for This Property
The Home Valuation Report is an in-depth analysis detailing your home's value as well as a comparison with similar homes in the area
Purchase History
| Date | Buyer | Sale Price | Title Company |
|---|---|---|---|
| Sarkisian Chad | -- | Stewart Title Of Calif | |
| Morrow Frank Ellsworth | -- | None Available | |
| Morrow Frank | $122,000 | Chicago Title Co | |
| Williams Peter | $110,000 | Stewart Title Co |
Source: Public Records
Mortgage History
| Date | Status | Borrower | Loan Amount |
|---|---|---|---|
| Previous Owner | Sarkisian Chad | $142,091 | |
| Previous Owner | Williams Peter | $98,550 |
Source: Public Records
Tax History
| Year | Tax Paid | Tax Assessment Tax Assessment Total Assessment is a certain percentage of the fair market value that is determined by local assessors to be the total taxable value of land and additions on the property. | Land | Improvement |
|---|---|---|---|---|
| 2025 | $6,205 | $178,983 | $51,503 | $127,480 |
| 2023 | $6,115 | $172,035 | $49,504 | $122,531 |
| 2022 | $6,100 | $168,663 | $48,534 | $120,129 |
| 2021 | $6,059 | $165,357 | $47,583 | $117,774 |
| 2020 | $6,039 | $163,663 | $47,096 | $116,567 |
| 2019 | $6,015 | $160,455 | $46,173 | $114,282 |
| 2018 | $1,728 | $157,310 | $45,268 | $112,042 |
| 2017 | $1,711 | $154,227 | $44,381 | $109,846 |
| 2016 | $1,552 | $151,204 | $43,511 | $107,693 |
| 2015 | $1,538 | $148,934 | $42,858 | $106,076 |
| 2014 | $1,501 | $146,018 | $42,019 | $103,999 |
Source: Public Records
Map
Nearby Homes
- 220 S Madera Ave Unit 10
- 220 S Madera Ave Unit SPC 9
- 14853 W Stanislaus Ave
- 14853 W Middleton Ave
- 15647 Wooten Ct
- 505 S Del Norte Ave
- 16172 W David Ave
- 16180 W David Ave
- 16190 W David Ave
- 16210 W David Ave
- 16220 W David Ave
- 687 S 8th St
- 16191 W David Ave
- 16209 W David Ave
- 443 S Park Ave
- 15783 Crimson Ave
- 14531 W Kearney Blvd
- 183 S Karen Ave
- 901 S 2nd St
- 520 S Burgundy St
- 15262 W El Mar Ln
- 15222 W El Mar Ln
- 15282 W El Mar Ln
- 15192 W El Mar Ln
- 15225 W El Mar Ln
- 15205 W El Mar Ln
- 15302 W El Mar Ln
- 15265 W El Mar Ln
- 15185 W El Mar Ln
- 15285 W El Mar Ln
- 15322 W El Mar Ln
- 15242 W San Joaquin Ave
- 15222 W San Joaquin Ave
- 15165 W El Mar Ln
- 15252 W San Joaquin Ave
- 15192 W San Joaquin Ave
- 15305 W El Mar Ln
- 15272 W San Joaquin Ave
- 15182 W San Joaquin Ave
- 15332 W El Mar Ln
Your Personal Tour Guide
Ask me questions while you tour the home.