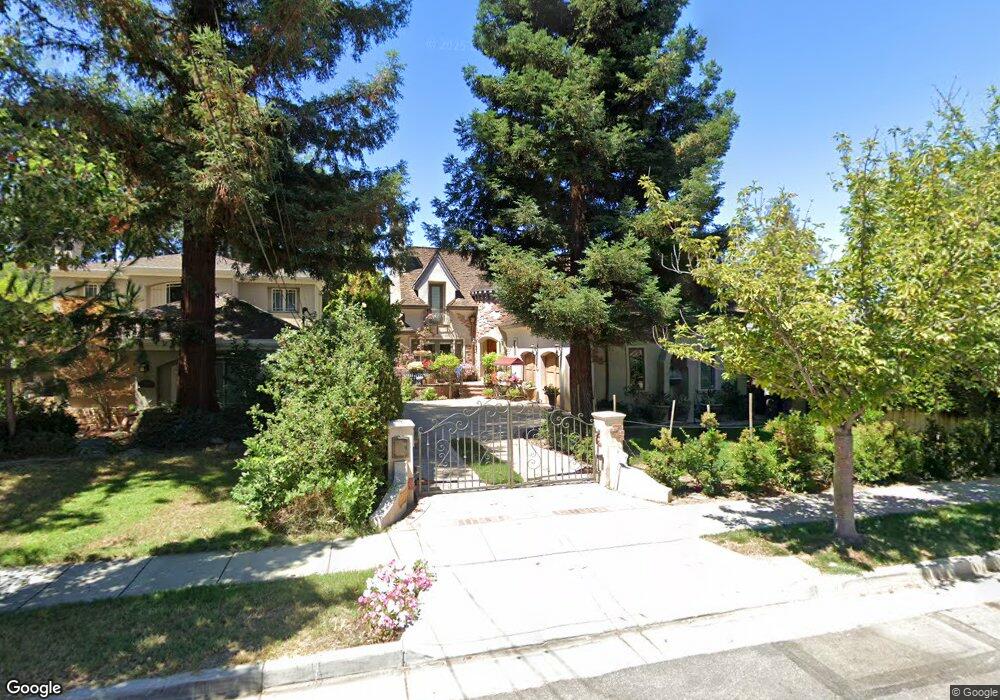
1526 Pine Glen Ct San Jose, CA 95125
Willow Glen NeighborhoodEstimated Value: $822,508 - $1,205,000
2
Beds
2
Baths
1,008
Sq Ft
$1,019/Sq Ft
Est. Value
About This Home
This home is located at 1526 Pine Glen Ct, San Jose, CA 95125 and is currently estimated at $1,027,127, approximately $1,018 per square foot. 1526 Pine Glen Ct is a home located in Santa Clara County with nearby schools including Willow Glen Elementary, Willow Glen Middle, and Willow Glen High School.
Ownership History
Date
Name
Owned For
Owner Type
Purchase Details
Closed on
Mar 18, 2011
Sold by
Lockheimer Frank Roy
Bought by
Lockheimer Frank Roy and Lockheimer Hiroko Y
Current Estimated Value
Purchase Details
Closed on
Nov 9, 2010
Sold by
Kelley R Andrew
Bought by
Lockheimer Frank Roy
Purchase Details
Closed on
Mar 25, 2004
Sold by
Murray Carrie
Bought by
Kelley R Andrew
Home Financials for this Owner
Home Financials are based on the most recent Mortgage that was taken out on this home.
Original Mortgage
$284,800
Interest Rate
4.62%
Mortgage Type
Purchase Money Mortgage
Purchase Details
Closed on
Aug 11, 1994
Sold by
Mordecai Leonard
Bought by
Lobue Samdra H
Home Financials for this Owner
Home Financials are based on the most recent Mortgage that was taken out on this home.
Original Mortgage
$146,700
Interest Rate
8.8%
Purchase Details
Closed on
Mar 21, 1994
Sold by
Bue Samdra H Lo
Bought by
Mordecai Leonard
Create a Home Valuation Report for This Property
The Home Valuation Report is an in-depth analysis detailing your home's value as well as a comparison with similar homes in the area
Home Values in the Area
Average Home Value in this Area
Purchase History
| Date | Buyer | Sale Price | Title Company |
|---|---|---|---|
| Lockheimer Frank Roy | -- | Fidelity National Title Ins | |
| Lockheimer Frank Roy | $408,000 | Fidelity National Title Co | |
| Kelley R Andrew | $356,000 | Alliance Title Company | |
| Murray Carrie L | -- | Alliance Title Company | |
| Lobue Samdra H | -- | Old Republic Title Company | |
| Murray Carrie | $163,000 | Old Republic Title Company | |
| Lobue Samdra H | -- | Old Republic Title Company | |
| Mordecai Leonard | -- | -- |
Source: Public Records
Mortgage History
| Date | Status | Borrower | Loan Amount |
|---|---|---|---|
| Previous Owner | Kelley R Andrew | $284,800 | |
| Previous Owner | Murray Carrie | $146,700 | |
| Closed | Kelley R Andrew | $71,200 |
Source: Public Records
Tax History Compared to Growth
Tax History
| Year | Tax Paid | Tax Assessment Tax Assessment Total Assessment is a certain percentage of the fair market value that is determined by local assessors to be the total taxable value of land and additions on the property. | Land | Improvement |
|---|---|---|---|---|
| 2025 | $7,344 | $522,704 | $261,352 | $261,352 |
| 2024 | $7,344 | $512,456 | $256,228 | $256,228 |
| 2023 | $7,181 | $502,408 | $251,204 | $251,204 |
| 2022 | $7,120 | $492,558 | $246,279 | $246,279 |
| 2021 | $6,944 | $482,900 | $241,450 | $241,450 |
| 2020 | $6,762 | $477,950 | $238,975 | $238,975 |
| 2019 | $6,603 | $468,580 | $234,290 | $234,290 |
| 2018 | $6,525 | $459,394 | $229,697 | $229,697 |
| 2017 | $6,465 | $450,388 | $225,194 | $225,194 |
| 2016 | $6,304 | $441,558 | $220,779 | $220,779 |
| 2015 | $6,254 | $434,926 | $217,463 | $217,463 |
| 2014 | $5,817 | $426,408 | $213,204 | $213,204 |
Source: Public Records
Map
Nearby Homes
- 1548 Lincoln Ave
- 1344 Iris Ct
- 1242 Minnesota Ave
- 1655 Everett Ave
- 1265 Blewett Ave
- 1176 Laurie Ave
- 1719 Glen Una Ave
- 1232 Coolidge Ave
- 0 Willow Glen Way
- 1110 Norval Way
- 1192 Crescent Dr
- 1768 Harmil Way
- 910 Pine Ave
- 1037 Hazelwood Ave
- 888 Pine Ave
- 1920 Glen Una Ave
- 910 Willowshire Way
- 1275 Bird Ave
- 1125 Camino Pablo
- 1159 Bird Ave Unit 2
- 1524 Pine Glen Ct
- 1522 Pine Glen Ct
- 1530 Pine Glen Ct
- 1520 Pine Glen Ct
- 1536 Glenpine Dr
- 1538 Glenpine Dr
- 1539 Iris Ct
- 1540 Glenpine Dr
- 1537 Glenpine Dr
- 1531 Iris Ct
- 1148 Glenmeadow Ct
- 1549 Iris Ct
- 1542 Glenpine Dr
- 1146 Glenmeadow Ct
- 1539 Glenpine Dr
- 1144 Glenmeadow Ct
- 1523 Iris Ct
- 1142 Glenmeadow Ct
- 1140 Glenmeadow Ct
- 1541 Glenpine Dr