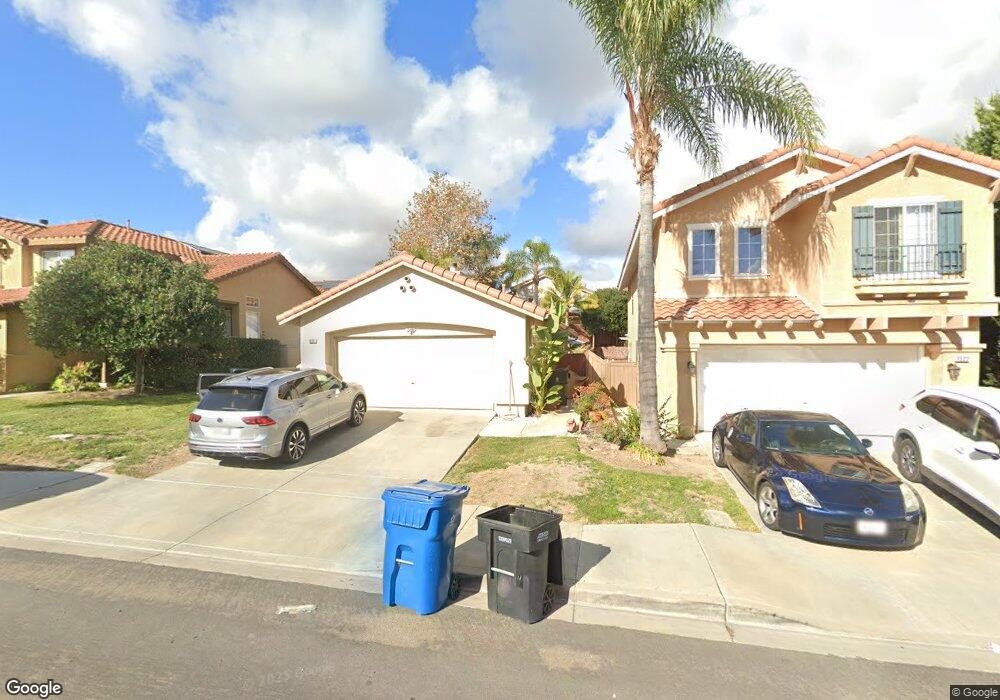
1526 Shoreacres Dr Chula Vista, CA 91915
Eastlake NeighborhoodEstimated Value: $796,000 - $886,000
3
Beds
2
Baths
1,226
Sq Ft
$682/Sq Ft
Est. Value
About This Home
This home is located at 1526 Shoreacres Dr, Chula Vista, CA 91915 and is currently estimated at $836,165, approximately $682 per square foot. 1526 Shoreacres Dr is a home located in San Diego County with nearby schools including Olympic View Elementary School, Eastlake Middle School, and Eastlake High School.
Ownership History
Date
Name
Owned For
Owner Type
Purchase Details
Closed on
Jul 19, 2018
Sold by
Coronado Diana Maria
Bought by
Coronado Juan Martin
Current Estimated Value
Purchase Details
Closed on
Jul 16, 2018
Sold by
Curcio Nancy A and Curcio Frank D
Bought by
Coronado Juan Martin and Coronado Kristian Rafael
Purchase Details
Closed on
Nov 13, 2009
Sold by
Curcio Frank D and Curcio Nancy A
Bought by
Curcio Frank D and Curcio Nancy A
Purchase Details
Closed on
Aug 27, 2003
Sold by
Dealva John L and Dealva Angela J
Bought by
Curcio Frank D and Curcio Nancy A
Purchase Details
Closed on
May 21, 1997
Sold by
Kaufman & Broad Of San Diego Inc
Bought by
Dealva John L and Dealva Angela J
Home Financials for this Owner
Home Financials are based on the most recent Mortgage that was taken out on this home.
Original Mortgage
$167,971
Interest Rate
8.13%
Mortgage Type
VA
Create a Home Valuation Report for This Property
The Home Valuation Report is an in-depth analysis detailing your home's value as well as a comparison with similar homes in the area
Home Values in the Area
Average Home Value in this Area
Purchase History
| Date | Buyer | Sale Price | Title Company |
|---|---|---|---|
| Coronado Juan Martin | -- | First American Title Sd | |
| Coronado Juan Martin | $525,000 | First American Title San Die | |
| Curcio Frank D | -- | None Available | |
| Curcio Frank D | $380,000 | Fidelity National Title Co | |
| Dealva John L | $165,000 | First American Title |
Source: Public Records
Mortgage History
| Date | Status | Borrower | Loan Amount |
|---|---|---|---|
| Previous Owner | Dealva John L | $167,971 |
Source: Public Records
Tax History Compared to Growth
Tax History
| Year | Tax Paid | Tax Assessment Tax Assessment Total Assessment is a certain percentage of the fair market value that is determined by local assessors to be the total taxable value of land and additions on the property. | Land | Improvement |
|---|---|---|---|---|
| 2025 | $6,690 | $585,640 | $160,125 | $425,515 |
| 2024 | $6,690 | $574,158 | $156,986 | $417,172 |
| 2023 | $6,580 | $562,901 | $153,908 | $408,993 |
| 2022 | $6,396 | $551,865 | $150,891 | $400,974 |
| 2021 | $6,903 | $541,045 | $147,933 | $393,112 |
| 2020 | $6,730 | $535,499 | $146,417 | $389,082 |
| 2019 | $6,552 | $525,000 | $143,547 | $381,453 |
| 2018 | $2,990 | $202,833 | $55,459 | $147,374 |
| 2017 | $2,934 | $198,857 | $54,372 | $144,485 |
| 2016 | $2,984 | $194,958 | $53,306 | $141,652 |
| 2015 | $2,949 | $192,031 | $52,506 | $139,525 |
| 2014 | $3,461 | $188,270 | $51,478 | $136,792 |
Source: Public Records
Map
Nearby Homes
- 1452 S Creekside Dr
- 1603 Quiet Trail Dr
- 2408 Green River Dr
- 1220 Silverado Dr
- 1277 Granite Springs Dr
- 1215 Pinehurst Rd
- 1572 Hackberry Place
- 1569 Hackberry Place
- 2710 Apricot Ct
- 2721 Castlehill Rd Unit 1
- 2235 Old Barn Ln
- 1427 Marble Canyon Way
- 2088 Bravo Loop
- 2065 Bravo Loop Unit 6
- 2745 White Pine Ct
- 1648 Sweet Gum Place
- 1505 Laurel Grove Dr Unit 3
- 1446 Caminito Sardinia
- 2744 Rambling Vista Rd
- 2754 Silver Medal Rd Unit 1
- 1530 Shoreacres Dr
- 1522 Shoreacres Dr
- 1534 Shoreacres Dr
- 1518 Shoreacres Dr
- 2466 Myrtle Beach Way
- 2462 Myrtle Beach Way
- 2470 Myrtle Beach Way
- 1538 Shoreacres Dr
- 2458 Myrtle Beach Way
- 1514 Shoreacres Dr
- 2474 Myrtle Beach Way
- 1525 Shoreacres Dr
- 1529 Shoreacres Dr
- 2454 Myrtle Beach Way
- 1519 Shoreacres Dr Unit 12
- 2478 Myrtle Beach Way
- 1533 Shoreacres Dr
- 1542 Shoreacres Dr
- 1510 Shoreacres Dr Unit 12
- 1515 Shoreacres Dr