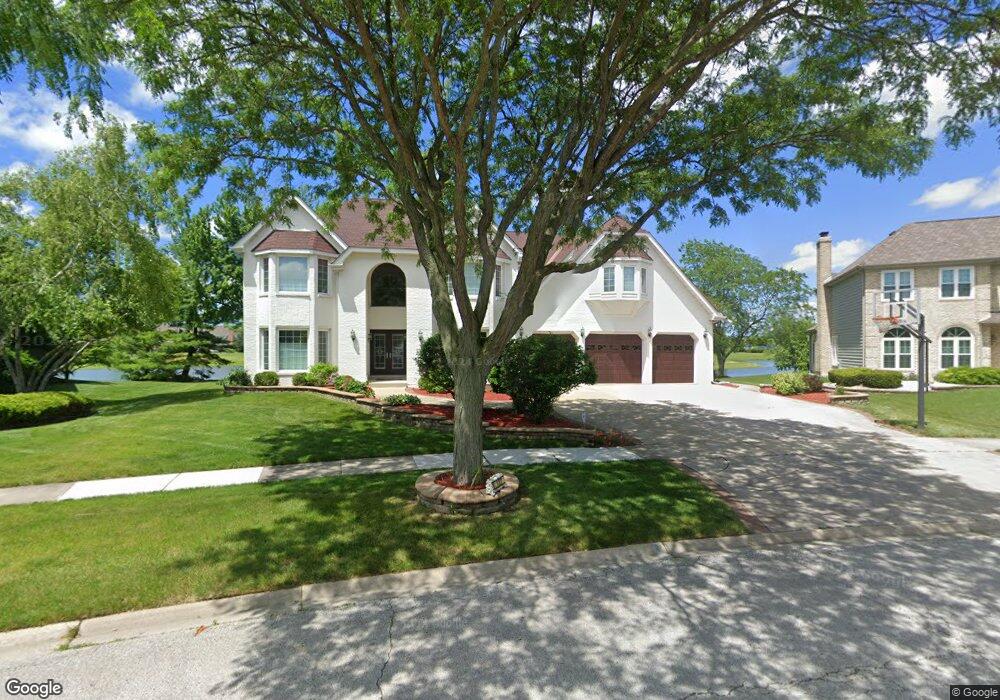
1527 Pine Lake Dr Naperville, IL 60564
Far East NeighborhoodEstimated Value: $958,000 - $1,053,000
4
Beds
4
Baths
5,017
Sq Ft
$202/Sq Ft
Est. Value
About This Home
This home is located at 1527 Pine Lake Dr, Naperville, IL 60564 and is currently estimated at $1,014,274, approximately $202 per square foot. 1527 Pine Lake Dr is a home located in DuPage County with nearby schools including White Eagle Elementary School, Still Middle School, and Waubonsie Valley High School.
Ownership History
Date
Name
Owned For
Owner Type
Purchase Details
Closed on
Jul 15, 2021
Sold by
Garg Rajesh K and Garg Sangita R
Bought by
Rajesh K Garg And Sangita R Garg Rev Tr
Current Estimated Value
Purchase Details
Closed on
Sep 6, 2001
Sold by
Garg Rajesh and Garg Sangita
Bought by
Garg Prem and Garg Rajesh K
Purchase Details
Closed on
Sep 8, 1997
Sold by
Cordero David B and Cordero Johanna B
Bought by
Cordero David B and Cordero Johanna B
Purchase Details
Closed on
Oct 2, 1996
Sold by
Cordero David B and Cordero Johanna B
Bought by
Alpha Security Asset Management Trust
Purchase Details
Closed on
Jun 21, 1996
Sold by
Harris Bank Naperville
Bought by
Cordero David B and Cordero Johanna B
Home Financials for this Owner
Home Financials are based on the most recent Mortgage that was taken out on this home.
Original Mortgage
$160,000
Interest Rate
7.74%
Create a Home Valuation Report for This Property
The Home Valuation Report is an in-depth analysis detailing your home's value as well as a comparison with similar homes in the area
Home Values in the Area
Average Home Value in this Area
Purchase History
| Date | Buyer | Sale Price | Title Company |
|---|---|---|---|
| Rajesh K Garg And Sangita R Garg Rev Tr | -- | Accommodation | |
| Garg Prem | -- | -- | |
| Cordero David B | -- | -- | |
| Alpha Security Asset Management Trust | -- | -- | |
| Cordero David B | -- | -- |
Source: Public Records
Mortgage History
| Date | Status | Borrower | Loan Amount |
|---|---|---|---|
| Previous Owner | Cordero David B | $160,000 |
Source: Public Records
Tax History Compared to Growth
Tax History
| Year | Tax Paid | Tax Assessment Tax Assessment Total Assessment is a certain percentage of the fair market value that is determined by local assessors to be the total taxable value of land and additions on the property. | Land | Improvement |
|---|---|---|---|---|
| 2024 | $24,148 | $339,535 | $87,563 | $251,972 |
| 2023 | $23,675 | $305,090 | $78,680 | $226,410 |
| 2022 | $19,320 | $241,730 | $70,810 | $170,920 |
| 2021 | $19,773 | $233,100 | $68,280 | $164,820 |
| 2020 | $20,500 | $266,930 | $68,280 | $198,650 |
| 2019 | $19,773 | $253,880 | $64,940 | $188,940 |
| 2018 | $21,101 | $266,450 | $68,360 | $198,090 |
| 2017 | $20,696 | $257,410 | $66,040 | $191,370 |
| 2016 | $13,250 | $153,170 | $63,380 | $89,790 |
| 2015 | $5,994 | $74,740 | $58,380 | $16,360 |
| 2014 | $18,284 | $200,080 | $60,830 | $139,250 |
| 2013 | $21,254 | $234,750 | $61,250 | $173,500 |
Source: Public Records
Map
Nearby Homes
- 4258 Stableford Ln
- 2255 Palmer Cir
- 2247 Palmer Cir
- 2219 Waterleaf Ct Unit 203
- 2220 Waterleaf Ct Unit 204
- 3901 White Eagle Dr W
- 2211 Skylane Dr
- 3316 Club Ct
- 4328 Chelsea Manor Cir
- 1348 Amaranth Dr
- 2527 Boddington Ln
- 1218 Birchdale Ln Unit 26
- 9S104 Aero Dr
- 4515 Chelsea Manor Cir
- 4511 Chelsea Manor Cir
- 4219 Chelsea Manor Cir
- 2611 Cedar Glade Dr Unit 204
- 2611 Cedar Glade Dr Unit 201
- 2228 Foxboro Ln
- 3536 Scottsdale Cir
- 1537 Pine Lake Dr
- 1517 Pine Lake Dr
- 1526 Pine Lake Dr
- 4320 Pine Lake Dr
- 1547 Pine Lake Dr Unit 6
- 1536 Pine Lake Dr
- 1557 Pine Lake Dr
- 4335 Pine Lake Dr
- 4330 Pine Lake Dr
- 1546 Pine Lake Dr
- 4345 Pine Lake Dr
- 4340 Pine Lake Dr Unit 6
- 4300 Lone Tree Ct
- 1556 Pine Lake Dr
- 4355 Pine Lake Dr
- 4350 Pine Lake Dr
- 1577 Pine Lake Dr
- 1576 Pine Lake Dr
- 4305 Lone Tree Ct
- 4315 Lone Tree Ct