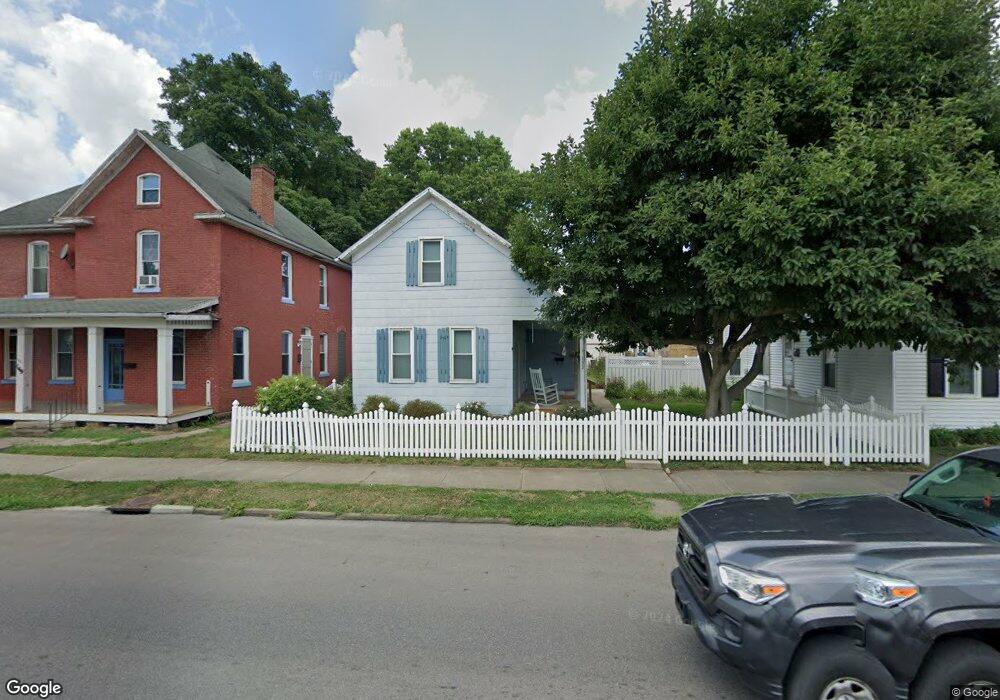
153 E 6th Ave Lancaster, OH 43130
Estimated Value: $127,000 - $187,000
2
Beds
1
Bath
1,090
Sq Ft
$146/Sq Ft
Est. Value
About This Home
This home is located at 153 E 6th Ave, Lancaster, OH 43130 and is currently estimated at $158,752, approximately $145 per square foot. 153 E 6th Ave is a home located in Fairfield County with nearby schools including Thomas Ewing Junior High School, Lancaster High School, and St Mary Elementary School.
Ownership History
Date
Name
Owned For
Owner Type
Purchase Details
Closed on
Aug 16, 2022
Sold by
Carol Richards
Bought by
Toth Julian Eric
Current Estimated Value
Home Financials for this Owner
Home Financials are based on the most recent Mortgage that was taken out on this home.
Original Mortgage
$72,250
Outstanding Balance
$67,291
Interest Rate
5.7%
Mortgage Type
New Conventional
Estimated Equity
$91,461
Purchase Details
Closed on
Sep 8, 2006
Sold by
Richards Steven K and Richards Carol
Bought by
Richards Steven K and Richards Carol
Create a Home Valuation Report for This Property
The Home Valuation Report is an in-depth analysis detailing your home's value as well as a comparison with similar homes in the area
Home Values in the Area
Average Home Value in this Area
Purchase History
| Date | Buyer | Sale Price | Title Company |
|---|---|---|---|
| Toth Julian Eric | -- | Olix & Associates Co Lpa | |
| Richards Steven K | -- | Attorney |
Source: Public Records
Mortgage History
| Date | Status | Borrower | Loan Amount |
|---|---|---|---|
| Open | Toth Julian Eric | $72,250 |
Source: Public Records
Tax History
| Year | Tax Paid | Tax Assessment Tax Assessment Total Assessment is a certain percentage of the fair market value that is determined by local assessors to be the total taxable value of land and additions on the property. | Land | Improvement |
|---|---|---|---|---|
| 2025 | $3,355 | $57,590 | $15,800 | $41,790 |
| 2024 | $3,355 | $37,320 | $7,640 | $29,680 |
| 2023 | $1,024 | $37,320 | $7,640 | $29,680 |
| 2022 | $1,043 | $37,320 | $7,640 | $29,680 |
| 2021 | $815 | $29,670 | $7,640 | $22,030 |
| 2020 | $781 | $29,670 | $7,640 | $22,030 |
| 2019 | $743 | $29,670 | $7,640 | $22,030 |
| 2018 | $485 | $24,360 | $7,640 | $16,720 |
| 2017 | $492 | $21,900 | $4,540 | $17,360 |
| 2016 | $479 | $21,900 | $4,540 | $17,360 |
| 2015 | $447 | $20,670 | $4,540 | $16,130 |
| 2014 | $426 | $20,670 | $4,540 | $16,130 |
| 2013 | $426 | $20,670 | $4,540 | $16,130 |
Source: Public Records
Map
Nearby Homes
- 600 N High St
- 233 E 6th Ave
- 165 Lake St
- 820 N Broad St
- 311 E Allen St
- 123 Arnold Ave
- 526 N Columbus St
- 515 N Columbus St
- 130 W Fair Ave
- 517 N Maple St
- 249 N Pearl Ave
- 233 Union St
- 154 E Main St
- 0 Slocum Ave
- 547 E Mulberry St
- 336 Reber Ave
- 330 Park St
- 534 E Wheeling St
- 0 N Columbus St
- 621 E Mulberry St
- 159 E 6th Ave
- 149 E 6th Ave
- 163 E 6th Ave
- 145 E 6th Ave
- 167 E 6th Ave
- 164 E Allen St
- 173 E 6th Ave Unit A
- 173 E 6th Ave
- 148 E 6th Ave
- 156 E Allen St
- 152 E Allen St
- 160 E Allen St
- 148 E Allen St
- 148 E Allen St Unit 148 1/2
- 144 E Allen St
- 140 E 6th Ave
- 168 E Allen St
- 140 E Allen St
- 140 1/2 E 6th Ave
- 152 E 6th Ave
Your Personal Tour Guide
Ask me questions while you tour the home.