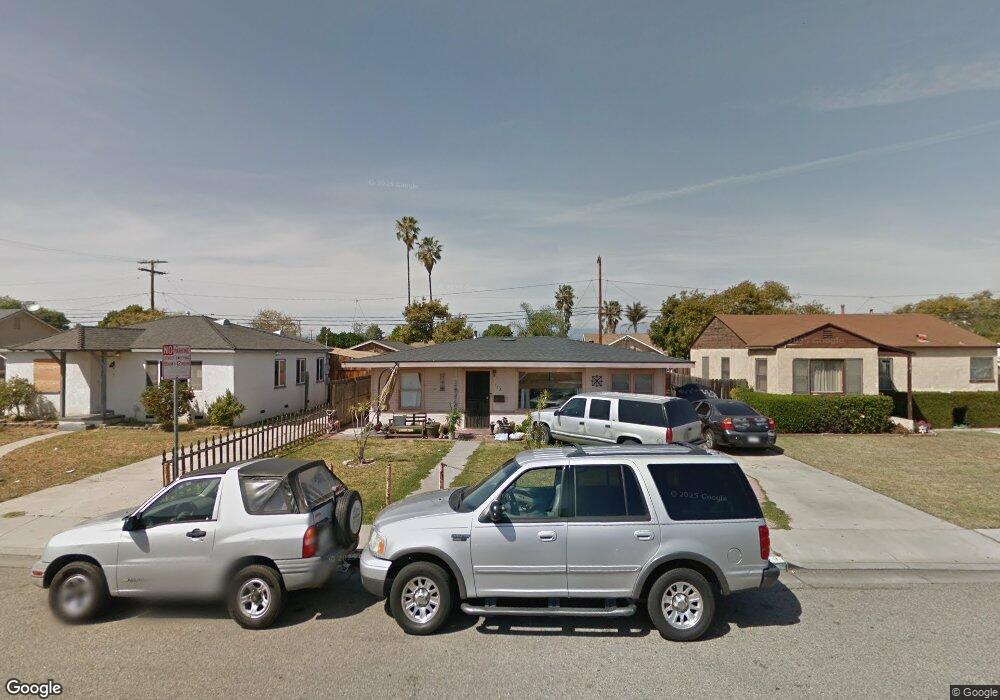
153 E Elm St Oxnard, CA 93033
Cal-Gisler NeighborhoodEstimated Value: $607,000 - $668,380
3
Beds
2
Baths
1,024
Sq Ft
$626/Sq Ft
Est. Value
About This Home
This home is located at 153 E Elm St, Oxnard, CA 93033 and is currently estimated at $641,095, approximately $626 per square foot. 153 E Elm St is a home located in Ventura County with nearby schools including Elm Street Elementary School, R.J. Frank Academy of Marine Science & Engineering, and Santa Clara High School.
Ownership History
Date
Name
Owned For
Owner Type
Purchase Details
Closed on
Apr 18, 2005
Sold by
Varquez Alfredo Echeverria and Echeverria Maria Isabel
Bought by
Varguez Alfredo Echeverria and Echeverria Maria Isabel
Current Estimated Value
Home Financials for this Owner
Home Financials are based on the most recent Mortgage that was taken out on this home.
Original Mortgage
$318,000
Outstanding Balance
$169,080
Interest Rate
6.25%
Mortgage Type
Purchase Money Mortgage
Estimated Equity
$472,015
Purchase Details
Closed on
Dec 5, 2001
Sold by
Ultreras Jesus and Ultreras Elvira
Bought by
Varguez Alfredo Echeverria and Echeverria Maria Isabel
Home Financials for this Owner
Home Financials are based on the most recent Mortgage that was taken out on this home.
Original Mortgage
$44,600
Interest Rate
6.04%
Mortgage Type
Stand Alone Second
Create a Home Valuation Report for This Property
The Home Valuation Report is an in-depth analysis detailing your home's value as well as a comparison with similar homes in the area
Home Values in the Area
Average Home Value in this Area
Purchase History
| Date | Buyer | Sale Price | Title Company |
|---|---|---|---|
| Varguez Alfredo Echeverria | $106,000 | Lawyers Title Company | |
| Varguez Alfredo Echeverria | $225,000 | Stewart Title |
Source: Public Records
Mortgage History
| Date | Status | Borrower | Loan Amount |
|---|---|---|---|
| Open | Varguez Alfredo Echeverria | $318,000 | |
| Previous Owner | Varguez Alfredo Echeverria | $44,600 | |
| Previous Owner | Varguez Alfredo Echeverria | $178,400 |
Source: Public Records
Tax History
| Year | Tax Paid | Tax Assessment Tax Assessment Total Assessment is a certain percentage of the fair market value that is determined by local assessors to be the total taxable value of land and additions on the property. | Land | Improvement |
|---|---|---|---|---|
| 2025 | $4,990 | $417,083 | $308,031 | $109,052 |
| 2024 | $4,990 | $408,905 | $301,991 | $106,914 |
| 2023 | $4,807 | $400,888 | $296,070 | $104,818 |
| 2022 | $4,661 | $393,028 | $290,265 | $102,763 |
| 2021 | $4,623 | $385,322 | $284,573 | $100,749 |
| 2020 | $4,707 | $381,373 | $281,656 | $99,717 |
| 2019 | $4,573 | $373,896 | $276,134 | $97,762 |
| 2018 | $4,508 | $366,566 | $270,720 | $95,846 |
| 2017 | $4,277 | $359,379 | $265,412 | $93,967 |
| 2016 | $4,126 | $352,333 | $260,208 | $92,125 |
| 2015 | $3,611 | $301,000 | $223,000 | $78,000 |
| 2014 | $2,872 | $238,000 | $176,000 | $62,000 |
Source: Public Records
Map
Nearby Homes
- 225 W Iris St
- 1239 S C St
- 1127 S C St
- 2024 S J St
- 865 S B St Unit Q1
- 819 S B St Unit 34
- 1030 Ilena St
- 633 Meta St
- 3151 Fournier St
- 3130 Paula St
- 2151 E Wooley Rd
- 603 S G St
- 550 S G St
- 1431 Casa San Carlos Ln Unit B
- 807 Kingfisher Way
- 1174 Oyster Place Unit 15
- 1501 Pisco Ln
- 3631 La Costa Place
- 3638 S B St
- 1140 Teakwood St
Your Personal Tour Guide
Ask me questions while you tour the home.