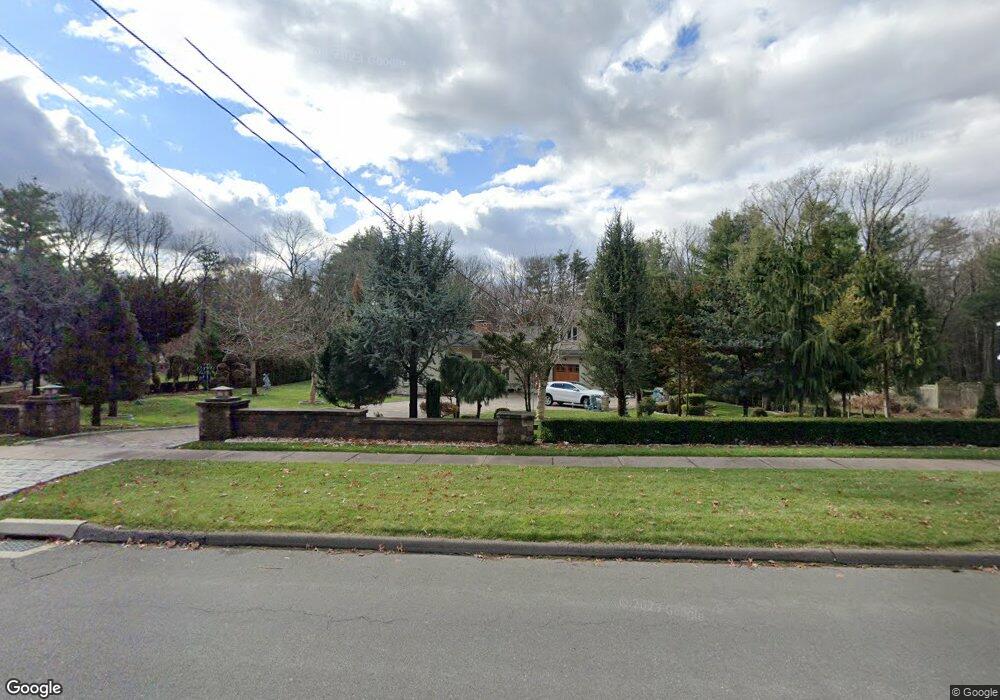
153 Hurlburt St Glastonbury, CT 06033
East Glastonbury NeighborhoodEstimated Value: $609,000 - $708,000
3
Beds
4
Baths
2,736
Sq Ft
$246/Sq Ft
Est. Value
About This Home
This home is located at 153 Hurlburt St, Glastonbury, CT 06033 and is currently estimated at $673,681, approximately $246 per square foot. 153 Hurlburt St is a home located in Hartford County with nearby schools including Eastbury School, Gideon Welles School, and Smith Middle School.
Ownership History
Date
Name
Owned For
Owner Type
Purchase Details
Closed on
Nov 15, 2005
Sold by
Peruggi Richard E and Peruggi Claudia S
Bought by
Chanduvi Romulo
Current Estimated Value
Home Financials for this Owner
Home Financials are based on the most recent Mortgage that was taken out on this home.
Original Mortgage
$300,000
Interest Rate
5.93%
Create a Home Valuation Report for This Property
The Home Valuation Report is an in-depth analysis detailing your home's value as well as a comparison with similar homes in the area
Home Values in the Area
Average Home Value in this Area
Purchase History
| Date | Buyer | Sale Price | Title Company |
|---|---|---|---|
| Chanduvi Romulo | $334,115 | -- |
Source: Public Records
Mortgage History
| Date | Status | Borrower | Loan Amount |
|---|---|---|---|
| Open | Chanduvi Romulo | $283,250 | |
| Closed | Chanduvi Romulo | $300,000 | |
| Previous Owner | Chanduvi Romulo | $150,000 | |
| Previous Owner | Chanduvi Romulo | $99,000 |
Source: Public Records
Tax History Compared to Growth
Tax History
| Year | Tax Paid | Tax Assessment Tax Assessment Total Assessment is a certain percentage of the fair market value that is determined by local assessors to be the total taxable value of land and additions on the property. | Land | Improvement |
|---|---|---|---|---|
| 2025 | $11,783 | $358,900 | $121,400 | $237,500 |
| 2024 | $11,460 | $358,900 | $121,400 | $237,500 |
| 2023 | $11,129 | $358,900 | $121,400 | $237,500 |
| 2022 | $10,399 | $278,800 | $100,300 | $178,500 |
| 2021 | $10,405 | $278,800 | $100,300 | $178,500 |
| 2020 | $10,288 | $278,800 | $100,300 | $178,500 |
| 2019 | $10,137 | $278,800 | $100,300 | $178,500 |
| 2018 | $9,299 | $258,300 | $100,300 | $158,000 |
| 2017 | $9,284 | $247,900 | $100,300 | $147,600 |
| 2016 | $9,002 | $247,300 | $100,300 | $147,000 |
| 2015 | $8,888 | $246,200 | $100,300 | $145,900 |
| 2014 | $8,253 | $231,500 | $100,300 | $131,200 |
Source: Public Records
Map
Nearby Homes
- 0 Hebron Ave
- 36 Sand Hill Ln
- 49 Millstone Rd
- 160 Pond Cir
- 509 Cedar Ridge Dr
- 92 Ash Swamp Rd
- 96 Crosby Rd
- 97 Crosby Rd
- 105 (Option A) Crosby Rd
- 105 (Option B) Crosby Rd
- 103 Forest Ln
- 297 Wickham Rd
- 366 Woodhaven Rd
- 60 Saddle Ridge Rd
- 28 Lazy Valley Rd
- 394 Woodhaven Rd
- 1925 Manchester Rd
- 47 Brookview Dr
- 2788 Hebron Ave
- 474 Neipsic Rd
- 165 Hurlburt St
- 141 Hurlburt St
- 360 Stanley Dr
- 30 Tanglewood Dr
- 36 Tanglewood Dr
- 12 Tanglewood Dr
- 160 Hurlburt St
- 170 Hurlburt St
- 140 Hurlburt St
- 125 Hurlburt St
- 187 Hurlburt St
- 130 Hurlburt St
- 361 Stanley Dr
- 188 Hurlburt St
- 120 Hurlburt St
- 27 Tanglewood Dr
- 351 Stanley Dr
- 436 Stanley Dr
- 37 Tanglewood Dr