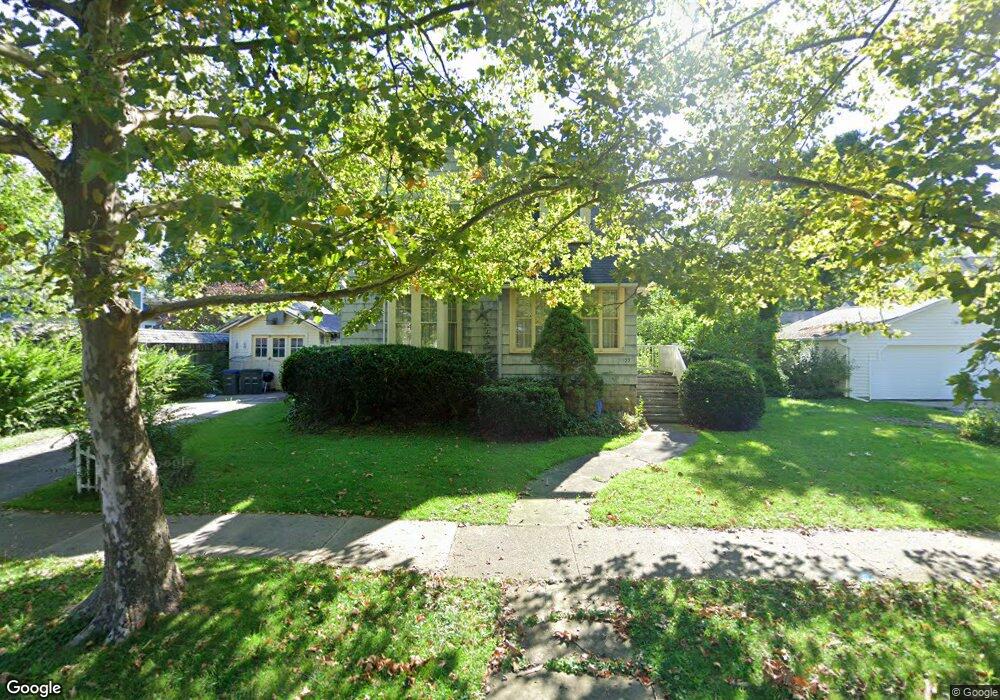
153 S Cedar St Oberlin, OH 44074
Estimated Value: $217,000 - $291,000
4
Beds
2
Baths
1,769
Sq Ft
$144/Sq Ft
Est. Value
About This Home
This home is located at 153 S Cedar St, Oberlin, OH 44074 and is currently estimated at $254,001, approximately $143 per square foot. 153 S Cedar St is a home located in Lorain County with nearby schools including Oberlin Elementary School, Prospect Elementary School, and Langston Middle School.
Ownership History
Date
Name
Owned For
Owner Type
Purchase Details
Closed on
Apr 28, 2016
Sold by
Reinker Elizabeth K
Bought by
Reinker Michael
Current Estimated Value
Purchase Details
Closed on
Apr 1, 2009
Sold by
Reinker Michael and Reinker Elizabeth K
Bought by
Reinker Michael
Home Financials for this Owner
Home Financials are based on the most recent Mortgage that was taken out on this home.
Original Mortgage
$121,600
Outstanding Balance
$78,263
Interest Rate
5.28%
Mortgage Type
New Conventional
Estimated Equity
$175,738
Purchase Details
Closed on
Feb 24, 2006
Sold by
Jindra William J and Jindra Robin K
Bought by
Reinker Michael E and Reinker Elizabeth K
Home Financials for this Owner
Home Financials are based on the most recent Mortgage that was taken out on this home.
Original Mortgage
$119,000
Interest Rate
6.2%
Mortgage Type
Fannie Mae Freddie Mac
Create a Home Valuation Report for This Property
The Home Valuation Report is an in-depth analysis detailing your home's value as well as a comparison with similar homes in the area
Home Values in the Area
Average Home Value in this Area
Purchase History
| Date | Buyer | Sale Price | Title Company |
|---|---|---|---|
| Reinker Michael | -- | -- | |
| Reinker Michael | -- | First American | |
| Reinker Michael E | -- | Northern Title Agency Inc |
Source: Public Records
Mortgage History
| Date | Status | Borrower | Loan Amount |
|---|---|---|---|
| Open | Reinker Michael | $121,600 | |
| Closed | Reinker Michael E | $119,000 |
Source: Public Records
Tax History
| Year | Tax Paid | Tax Assessment Tax Assessment Total Assessment is a certain percentage of the fair market value that is determined by local assessors to be the total taxable value of land and additions on the property. | Land | Improvement |
|---|---|---|---|---|
| 2024 | $3,198 | $64,579 | $9,468 | $55,111 |
| 2023 | $3,221 | $58,590 | $7,504 | $51,086 |
| 2022 | $3,135 | $58,590 | $7,504 | $51,086 |
| 2021 | $3,129 | $58,590 | $7,500 | $51,090 |
| 2020 | $2,916 | $51,350 | $6,580 | $44,770 |
| 2019 | $2,880 | $51,350 | $6,580 | $44,770 |
| 2018 | $2,733 | $51,350 | $6,580 | $44,770 |
| 2017 | $2,566 | $46,750 | $4,740 | $42,010 |
| 2016 | $2,592 | $46,750 | $4,740 | $42,010 |
| 2015 | $2,594 | $46,750 | $4,740 | $42,010 |
| 2014 | $2,508 | $44,100 | $4,470 | $39,630 |
| 2013 | $2,465 | $44,100 | $4,470 | $39,630 |
Source: Public Records
Map
Nearby Homes
- 149 Morgan St
- 147 Morgan St
- 215 W College St
- 123 S Professor St
- 121 S Professor St
- 89 S Professor St
- 252 W College St
- 62 N Prospect St
- 18 Edison St
- 32 W Lincoln St
- 83 S Pleasant St
- 246 W Hamilton St
- 0 S Park St
- 27 Union St
- 603 Beech St
- VL E Hamilton St
- 249 N Main St
- 180 N Park St
- 258 N Pleasant St
- 182 E Hamilton St
Your Personal Tour Guide
Ask me questions while you tour the home.