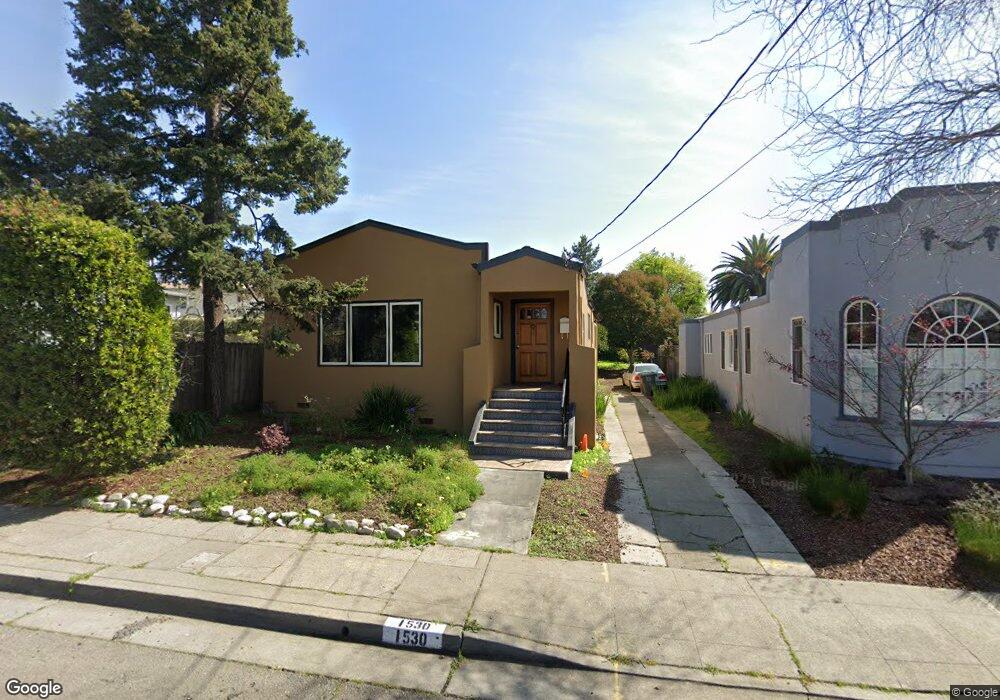
1530 Cedar St Berkeley, CA 94703
North Berkeley NeighborhoodEstimated Value: $1,210,000 - $1,762,000
3
Beds
2
Baths
1,454
Sq Ft
$972/Sq Ft
Est. Value
About This Home
This home is located at 1530 Cedar St, Berkeley, CA 94703 and is currently estimated at $1,413,568, approximately $972 per square foot. 1530 Cedar St is a home located in Alameda County with nearby schools including Ruth Acty Elementary, Berkeley Arts Magnet at Whittier School, and Thousand Oaks Elementary School.
Ownership History
Date
Name
Owned For
Owner Type
Purchase Details
Closed on
Sep 23, 2016
Sold by
Ballew Randall M and Dyson Deborah A
Bought by
Ballew Randall Meredith and Dyson Deborah Ann
Current Estimated Value
Purchase Details
Closed on
Oct 6, 1993
Sold by
Tannenbaum Daniel and Tannenbaum Danny
Bought by
Ballew Randall M and Dyson Deborah A
Home Financials for this Owner
Home Financials are based on the most recent Mortgage that was taken out on this home.
Original Mortgage
$174,300
Interest Rate
6.62%
Create a Home Valuation Report for This Property
The Home Valuation Report is an in-depth analysis detailing your home's value as well as a comparison with similar homes in the area
Home Values in the Area
Average Home Value in this Area
Purchase History
| Date | Buyer | Sale Price | Title Company |
|---|---|---|---|
| Ballew Randall Meredith | -- | None Available | |
| Ballew Randall M | $87,500 | First American Title |
Source: Public Records
Mortgage History
| Date | Status | Borrower | Loan Amount |
|---|---|---|---|
| Closed | Ballew Randall M | $174,300 | |
| Closed | Ballew Randall M | $11,700 |
Source: Public Records
Tax History
| Year | Tax Paid | Tax Assessment Tax Assessment Total Assessment is a certain percentage of the fair market value that is determined by local assessors to be the total taxable value of land and additions on the property. | Land | Improvement |
|---|---|---|---|---|
| 2025 | $8,209 | $400,391 | $104,865 | $302,526 |
| 2024 | $8,209 | $392,404 | $102,809 | $296,595 |
| 2023 | $7,971 | $391,573 | $100,793 | $290,780 |
| 2022 | $7,956 | $376,896 | $98,817 | $285,079 |
| 2021 | $7,952 | $369,370 | $96,880 | $279,490 |
| 2020 | $7,537 | $372,510 | $95,886 | $276,624 |
| 2019 | $7,229 | $365,207 | $94,006 | $271,201 |
| 2018 | $7,067 | $358,047 | $92,163 | $265,884 |
| 2017 | $6,800 | $351,029 | $90,357 | $260,672 |
| 2016 | $6,539 | $344,147 | $88,585 | $255,562 |
| 2015 | $6,430 | $338,980 | $87,255 | $251,725 |
| 2014 | $6,300 | $332,340 | $85,546 | $246,794 |
Source: Public Records
Map
Nearby Homes
- 1564 Sacramento St
- 1368 Rose St
- 1813 Sacramento St
- 1808 Cedar St
- 1411 Hearst Ave Unit 2
- 1626 Hopkins St
- 1322 Virginia St
- 1625 Martin Luther King jr Way
- 1631 Belvedere Ave
- 1425 Martin Luther King jr Way
- 1609 Bonita Ave Unit 5
- 1610 Milvia St
- 2118 California St
- 1261 Hearst Ave
- 1728 Curtis St
- 2112 Mckinley Ave Unit D
- 2218 -2222 Grant St
- 1578 Allston Way
- 1408 Henry St
- 1509 Francis St
- 1528 Cedar St
- 1526 Cedar St
- 1604 California St
- 1608 California St
- 1600 California St
- 1612 California St
- 1522 Cedar St
- 1616 California St
- 1535 Lincoln St
- 1531 Lincoln St
- 1539 Lincoln St
- 1520 Cedar St
- 1527 Lincoln St
- 1618 California St
- 1537 Cedar St
- 1525 Lincoln St
- 1533 Cedar St
- 1541 Cedar St
- 1516 Cedar St
- 1595 Holly St
Your Personal Tour Guide
Ask me questions while you tour the home.