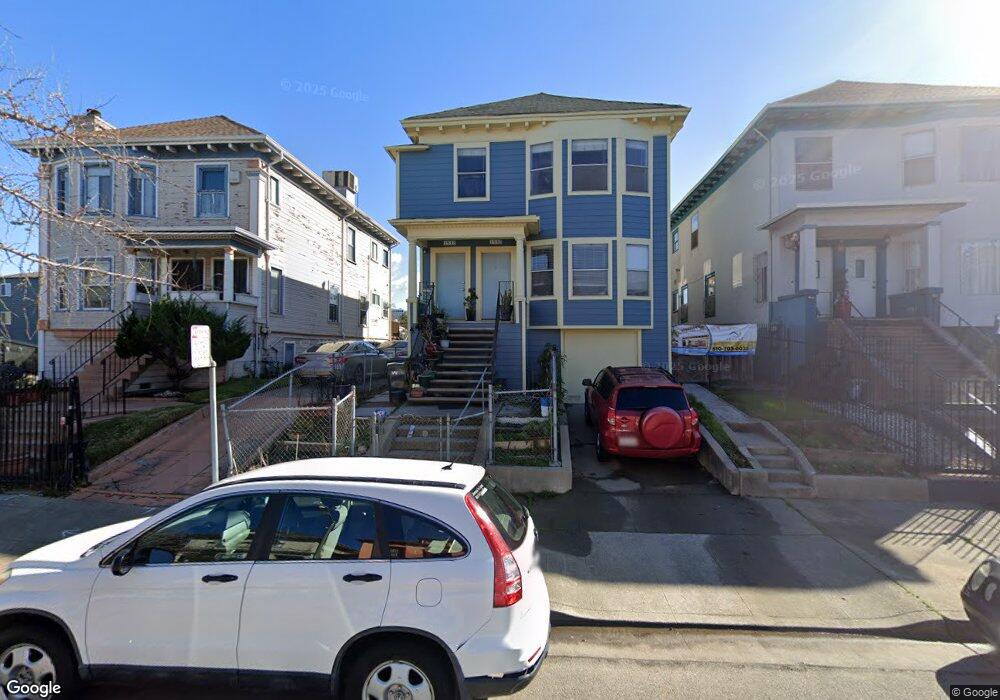
1530 Myrtle St Oakland, CA 94607
West Oakland NeighborhoodEstimated Value: $606,000 - $892,716
5
Beds
2
Baths
2,256
Sq Ft
$339/Sq Ft
Est. Value
About This Home
This home is located at 1530 Myrtle St, Oakland, CA 94607 and is currently estimated at $765,429, approximately $339 per square foot. 1530 Myrtle St is a home located in Alameda County with nearby schools including M. L. King Jr. Elementary School, West Oakland Middle School, and McClymonds High School.
Ownership History
Date
Name
Owned For
Owner Type
Purchase Details
Closed on
Apr 26, 1999
Sold by
Fraziear Thelma L
Bought by
Avakian Gary C
Current Estimated Value
Home Financials for this Owner
Home Financials are based on the most recent Mortgage that was taken out on this home.
Original Mortgage
$141,600
Outstanding Balance
$36,344
Interest Rate
6.96%
Estimated Equity
$729,085
Create a Home Valuation Report for This Property
The Home Valuation Report is an in-depth analysis detailing your home's value as well as a comparison with similar homes in the area
Home Values in the Area
Average Home Value in this Area
Purchase History
| Date | Buyer | Sale Price | Title Company |
|---|---|---|---|
| Avakian Gary C | $177,000 | Nortwestern Title Company |
Source: Public Records
Mortgage History
| Date | Status | Borrower | Loan Amount |
|---|---|---|---|
| Open | Avakian Gary C | $141,600 |
Source: Public Records
Tax History
| Year | Tax Paid | Tax Assessment Tax Assessment Total Assessment is a certain percentage of the fair market value that is determined by local assessors to be the total taxable value of land and additions on the property. | Land | Improvement |
|---|---|---|---|---|
| 2025 | $5,695 | $270,468 | $83,240 | $194,228 |
| 2024 | $5,695 | $265,028 | $81,608 | $190,420 |
| 2023 | $5,850 | $266,695 | $80,008 | $186,687 |
| 2022 | $5,571 | $254,467 | $78,440 | $183,027 |
| 2021 | $5,150 | $249,341 | $76,902 | $179,439 |
| 2020 | $5,089 | $253,713 | $76,114 | $177,599 |
| 2019 | $4,784 | $248,738 | $74,621 | $174,117 |
| 2018 | $4,686 | $243,863 | $73,159 | $170,704 |
| 2017 | $4,460 | $239,081 | $71,724 | $167,357 |
| 2016 | $4,254 | $234,395 | $70,318 | $164,077 |
| 2015 | $4,226 | $230,874 | $69,262 | $161,612 |
| 2014 | $4,286 | $226,352 | $67,905 | $158,447 |
Source: Public Records
Map
Nearby Homes
Your Personal Tour Guide
Ask me questions while you tour the home.