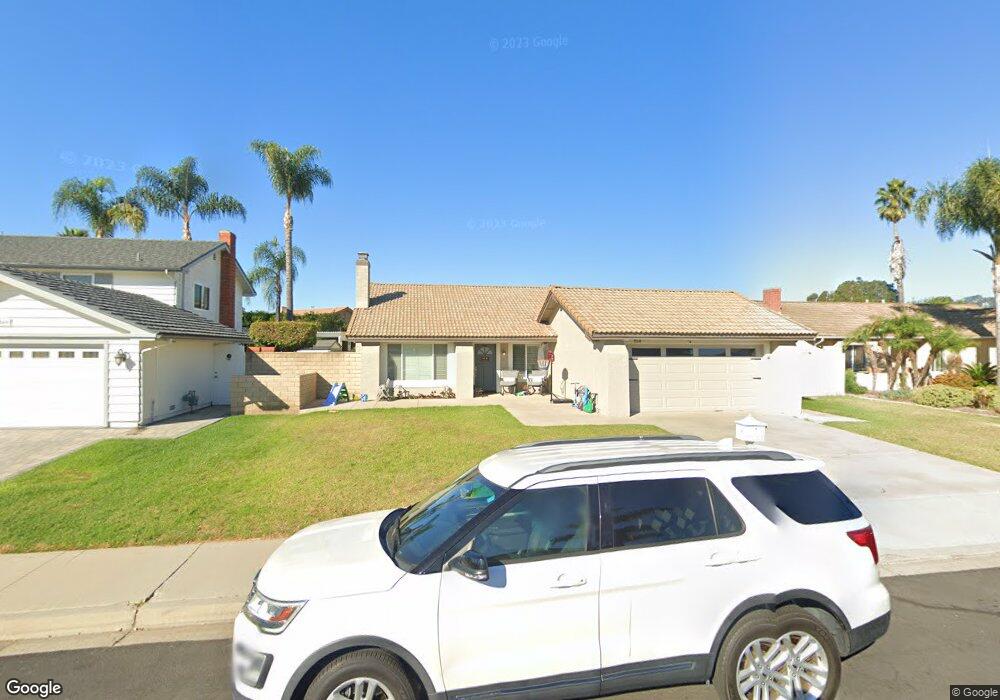
1531 Sierra Madre Dr Camarillo, CA 93010
Estimated Value: $835,000 - $1,034,000
3
Beds
2
Baths
1,691
Sq Ft
$536/Sq Ft
Est. Value
About This Home
This home is located at 1531 Sierra Madre Dr, Camarillo, CA 93010 and is currently estimated at $907,112, approximately $536 per square foot. 1531 Sierra Madre Dr is a home located in Ventura County with nearby schools including Monte Vista Middle School, Adolfo Camarillo High School, and University Preparation Charter School at CSU Channel Islands.
Ownership History
Date
Name
Owned For
Owner Type
Purchase Details
Closed on
Apr 19, 2023
Sold by
Drehsen Richard Charles
Bought by
Richard Charles Drehsen 2023 Revocable Trust
Current Estimated Value
Purchase Details
Closed on
Sep 10, 2021
Sold by
Drehsen Richard Charles and Wauchope Laura Michelle
Bought by
Drehsen Richard Charles and Drehsen Laura Michelle
Home Financials for this Owner
Home Financials are based on the most recent Mortgage that was taken out on this home.
Original Mortgage
$460,000
Interest Rate
2.88%
Purchase Details
Closed on
Sep 18, 2015
Sold by
Hagle Gail and Hagle Ricke E
Bought by
Drehsen Richard Charles and Wauchope Laura Michelle
Home Financials for this Owner
Home Financials are based on the most recent Mortgage that was taken out on this home.
Original Mortgage
$458,949
Interest Rate
3.81%
Mortgage Type
New Conventional
Create a Home Valuation Report for This Property
The Home Valuation Report is an in-depth analysis detailing your home's value as well as a comparison with similar homes in the area
Home Values in the Area
Average Home Value in this Area
Purchase History
| Date | Buyer | Sale Price | Title Company |
|---|---|---|---|
| Richard Charles Drehsen 2023 Revocable Trust | -- | None Listed On Document | |
| Drehsen Richard Charles | -- | Fidelity National Title Co | |
| Drehsen Richard Charles | $510,000 | Chicago Title Company |
Source: Public Records
Mortgage History
| Date | Status | Borrower | Loan Amount |
|---|---|---|---|
| Previous Owner | Drehsen Richard Charles | $460,000 | |
| Previous Owner | Drehsen Richard Charles | $458,949 |
Source: Public Records
Tax History Compared to Growth
Tax History
| Year | Tax Paid | Tax Assessment Tax Assessment Total Assessment is a certain percentage of the fair market value that is determined by local assessors to be the total taxable value of land and additions on the property. | Land | Improvement |
|---|---|---|---|---|
| 2025 | $6,641 | $603,729 | $392,424 | $211,305 |
| 2024 | $6,641 | $591,892 | $384,730 | $207,162 |
| 2023 | $6,403 | $580,287 | $377,187 | $203,100 |
| 2022 | $6,384 | $568,909 | $369,791 | $199,118 |
| 2021 | $6,155 | $557,754 | $362,540 | $195,214 |
| 2020 | $6,133 | $552,037 | $358,824 | $193,213 |
| 2019 | $6,106 | $541,214 | $351,789 | $189,425 |
| 2018 | $5,994 | $530,603 | $344,892 | $185,711 |
| 2017 | $5,641 | $520,200 | $338,130 | $182,070 |
| 2016 | $5,507 | $510,000 | $331,500 | $178,500 |
| 2015 | $2,389 | $222,757 | $55,675 | $167,082 |
| 2014 | $2,333 | $218,396 | $54,586 | $163,810 |
Source: Public Records
Map
Nearby Homes
- 1775 Temple Ave
- 2875 Munson St
- 2228 Camilar Dr
- 2280 Camilar Dr
- 2111 Calaveras Dr
- 1690 Loma Dr
- 2113 Euclid Ave
- 2251 Camilar Dr
- 2047 Euclid Ave
- 1772 Weston Cir
- 2229 Camilar Dr
- 2201 Camilar Dr
- 2174 Wilcox St
- 2104 Dunnigan St
- 876 Palmer Ave
- 2496 Parkway Dr
- 865 Mobil Ave
- 1892 Dunnigan St
- 314 Anacapa Dr
- 1709 Las Posas Rd
- 1509 Sierra Madre Dr
- 1553 Sierra Madre Dr
- 2492 Balmoral Ct
- 2493 Balmoral Ct
- 1489 Sierra Madre Dr
- 1569 Sierra Madre Dr
- 2480 Balmoral Ct
- 1532 Sierra Madre Dr
- 1510 Sierra Madre Dr
- 1554 Sierra Madre Dr
- 2481 Balmoral Ct
- 2479 Deerfield Ct
- 2491 Deerfield Ct
- 1467 Sierra Madre Dr
- 1490 Sierra Madre Dr
- 1570 Sierra Madre Dr
- 1591 Sierra Madre Dr
- 2576 Kimberly Ave
- 2468 Balmoral Ct
- 2469 Balmoral Ct