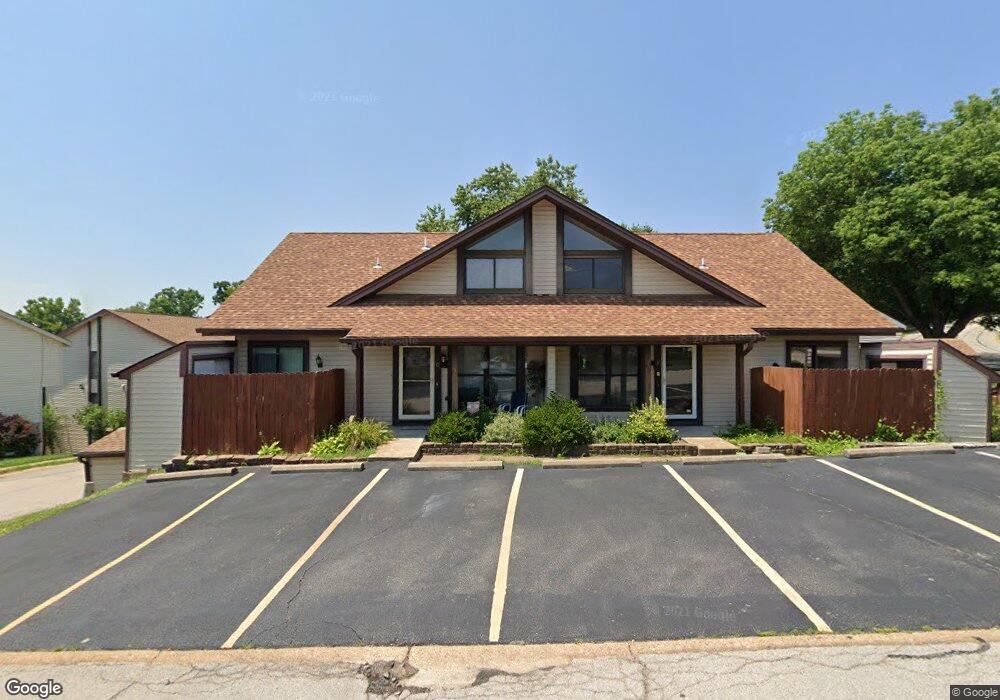
154 Chatterbird Ln Unit C Eureka, MO 63025
Estimated Value: $180,319 - $215,000
3
Beds
2
Baths
1,215
Sq Ft
$161/Sq Ft
Est. Value
About This Home
This home is located at 154 Chatterbird Ln Unit C, Eureka, MO 63025 and is currently estimated at $195,330, approximately $160 per square foot. 154 Chatterbird Ln Unit C is a home located in St. Louis County with nearby schools including Eureka Elementary School, Lasalle Springs Middle School, and Eureka Senior High School.
Ownership History
Date
Name
Owned For
Owner Type
Purchase Details
Closed on
Feb 18, 2005
Sold by
Eaton Tina K
Bought by
Brennan Joseph and Brennan Virginia
Current Estimated Value
Home Financials for this Owner
Home Financials are based on the most recent Mortgage that was taken out on this home.
Original Mortgage
$106,800
Outstanding Balance
$59,947
Interest Rate
7.37%
Mortgage Type
Unknown
Estimated Equity
$135,383
Purchase Details
Closed on
Nov 5, 1999
Sold by
Davis Betty H
Bought by
Eaton Tina K
Home Financials for this Owner
Home Financials are based on the most recent Mortgage that was taken out on this home.
Original Mortgage
$79,540
Interest Rate
7.73%
Purchase Details
Closed on
May 22, 1997
Sold by
Campbell Barbara A
Bought by
Davis Betty H
Home Financials for this Owner
Home Financials are based on the most recent Mortgage that was taken out on this home.
Original Mortgage
$63,200
Interest Rate
8.17%
Create a Home Valuation Report for This Property
The Home Valuation Report is an in-depth analysis detailing your home's value as well as a comparison with similar homes in the area
Home Values in the Area
Average Home Value in this Area
Purchase History
| Date | Buyer | Sale Price | Title Company |
|---|---|---|---|
| Brennan Joseph | $106,800 | Nations Title Agency Mo Inc | |
| Eaton Tina K | $82,000 | -- | |
| Davis Betty H | -- | -- |
Source: Public Records
Mortgage History
| Date | Status | Borrower | Loan Amount |
|---|---|---|---|
| Open | Brennan Joseph | $106,800 | |
| Previous Owner | Eaton Tina K | $79,540 | |
| Previous Owner | Davis Betty H | $63,200 |
Source: Public Records
Tax History
| Year | Tax Paid | Tax Assessment Tax Assessment Total Assessment is a certain percentage of the fair market value that is determined by local assessors to be the total taxable value of land and additions on the property. | Land | Improvement |
|---|---|---|---|---|
| 2025 | $1,863 | $30,840 | $10,170 | $20,670 |
| 2024 | $1,863 | $24,960 | $5,070 | $19,890 |
| 2023 | $1,865 | $24,960 | $5,070 | $19,890 |
| 2022 | $1,841 | $22,920 | $7,620 | $15,300 |
| 2021 | $1,827 | $22,920 | $7,620 | $15,300 |
| 2020 | $1,451 | $17,400 | $2,660 | $14,740 |
| 2019 | $1,455 | $17,400 | $2,660 | $14,740 |
| 2018 | $1,267 | $14,290 | $3,230 | $11,060 |
| 2016 | $1,312 | $14,770 | $2,890 | $11,880 |
Source: Public Records
Map
Nearby Homes
- 15 Rockwood Place Ct
- 126 Shaw Dr
- 568 Hilltop Townes Dr
- 16805 Enderbush Ln
- 897 Top Notch Ln
- 637 N Virginia Ave
- 17114 Elm Trail Dr
- 944 Emerald Oaks Ct
- 1 Fairway Estates Ct
- 917 Emerald Oaks Ct
- 4606 Hickory Ridge View Ct
- 17457 Wyman Ridge Dr
- 412 Parkview Ln
- 744 Forby Rd
- 500 Overlook Terrace Ct
- 17498 Wyman Ridge Dr
- 17513 Wyman Ridge Dr
- 345 Palisades Ridge Ct
- 329 Kevin Jon Ct
- 318 Kevin Jon Ct
- 154 Chatterbird Ln Unit D
- 154 Beard Dr Unit A
- 154 Chatterbird Ln Unit B
- 155 Beard Dr Unit C
- 155 Beard Dr Unit D
- 155 Beard Dr Unit B
- 155 Beard Dr Unit A
- 155 Beard Dr Unit D
- 158 Beard Dr Unit D
- 158 Beard Dr Unit B
- 158 Beard Dr Unit A
- 157 Chatterbird Ln Unit B
- 157 Chatterbird Ln Unit D
- 157 Chatterbird Ln Unit C
- 157 Chatterbird Ln Unit A
- 156 Beard Dr Unit B
- 156 Beard Dr Unit A
- 161 Dartingbird Ln Unit C
- 161 Dartingbird Ln Unit D
Your Personal Tour Guide
Ask me questions while you tour the home.