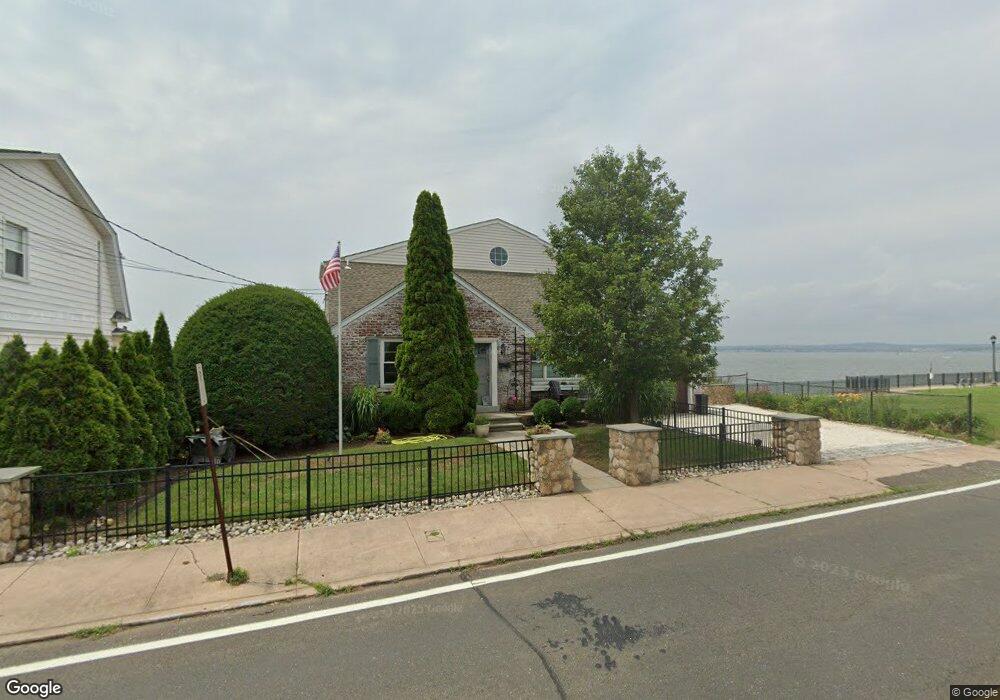
154 Townsend Ave New Haven, CT 06512
East Shore NeighborhoodEstimated Value: $539,000 - $830,000
3
Beds
1
Bath
2,127
Sq Ft
$330/Sq Ft
Est. Value
About This Home
This home is located at 154 Townsend Ave, New Haven, CT 06512 and is currently estimated at $702,492, approximately $330 per square foot. 154 Townsend Ave is a home located in New Haven County with nearby schools including All Nations Christian Academy and Pathway School.
Ownership History
Date
Name
Owned For
Owner Type
Purchase Details
Closed on
Apr 8, 2011
Sold by
Sea Brook Invest Inc
Bought by
Papuga Christopher
Current Estimated Value
Home Financials for this Owner
Home Financials are based on the most recent Mortgage that was taken out on this home.
Original Mortgage
$341,127
Outstanding Balance
$242,893
Interest Rate
5.5%
Mortgage Type
FHA
Estimated Equity
$459,599
Purchase Details
Closed on
Aug 19, 1996
Sold by
Benedetti Ronald
Bought by
Seabrook Investments
Home Financials for this Owner
Home Financials are based on the most recent Mortgage that was taken out on this home.
Original Mortgage
$137,700
Interest Rate
5.25%
Mortgage Type
Unknown
Purchase Details
Closed on
May 24, 1989
Sold by
Tarducci Lawrence G
Bought by
Benedetti Ronald
Home Financials for this Owner
Home Financials are based on the most recent Mortgage that was taken out on this home.
Original Mortgage
$255,000
Interest Rate
10.99%
Create a Home Valuation Report for This Property
The Home Valuation Report is an in-depth analysis detailing your home's value as well as a comparison with similar homes in the area
Home Values in the Area
Average Home Value in this Area
Purchase History
| Date | Buyer | Sale Price | Title Company |
|---|---|---|---|
| Papuga Christopher | $350,000 | -- | |
| Seabrook Investments | $7,247 | -- | |
| Benedetti Ronald | $265,000 | -- |
Source: Public Records
Mortgage History
| Date | Status | Borrower | Loan Amount |
|---|---|---|---|
| Open | Benedetti Ronald | $65,000 | |
| Open | Benedetti Ronald | $341,127 | |
| Previous Owner | Benedetti Ronald | $137,700 | |
| Previous Owner | Benedetti Ronald | $255,000 |
Source: Public Records
Tax History Compared to Growth
Tax History
| Year | Tax Paid | Tax Assessment Tax Assessment Total Assessment is a certain percentage of the fair market value that is determined by local assessors to be the total taxable value of land and additions on the property. | Land | Improvement |
|---|---|---|---|---|
| 2025 | $15,878 | $402,990 | $200,550 | $202,440 |
| 2024 | $15,515 | $402,990 | $200,550 | $202,440 |
| 2023 | $14,991 | $402,990 | $200,550 | $202,440 |
| 2022 | $16,019 | $402,990 | $200,550 | $202,440 |
| 2021 | $12,661 | $288,540 | $130,340 | $158,200 |
| 2020 | $12,661 | $288,540 | $130,340 | $158,200 |
| 2019 | $12,401 | $288,540 | $130,340 | $158,200 |
| 2018 | $12,401 | $288,540 | $130,340 | $158,200 |
| 2017 | $11,161 | $288,540 | $130,340 | $158,200 |
| 2016 | $11,649 | $280,350 | $127,470 | $152,880 |
| 2015 | $11,349 | $273,140 | $127,470 | $145,670 |
| 2014 | $9,691 | $233,240 | $127,470 | $105,770 |
Source: Public Records
Map
Nearby Homes
- 34 Beecher Place
- 26 Nelson St
- 75 Townsend Ave
- 60 Townsend Ave
- 50 Concord St
- 20 Ira St
- 1820 Dean St
- 114 Cove St
- 119 Cove St
- 86 Cove St
- 52 Stuyvesant Ave
- 280 Marion St
- 44 Meadow View Rd
- 140 Townsend Terrace
- 366 Burr St
- 3 Stoddard Rd
- 4 Laura Ln
- 745 Townsend Ave Unit Lot 1
- 745 Townsend Ave Unit Lot 2
- 745 Townsend Ave Unit Lot 4
- 150 Townsend Ave
- 146 Townsend Ave
- 114 Townsend Ave
- 165 Townsend Ave
- 165 Townsend Ave Unit 1ST F
- 144 Townsend Ave
- 151 Townsend Ave
- 171 Townsend Ave
- 147 Townsend Ave
- 138 Townsend Ave
- 143 Townsend Ave
- 183 Townsend Ave Unit D
- 183 Townsend Ave Unit A
- 183 Townsend Ave
- 183 Townsend Ave Unit 2
- 183 Townsend Ave Unit 2F
- 183 Townsend Ave Unit 1
- 183 Townsend Ave Unit 1F
- 139 Townsend Ave
- 15 Beecher Place