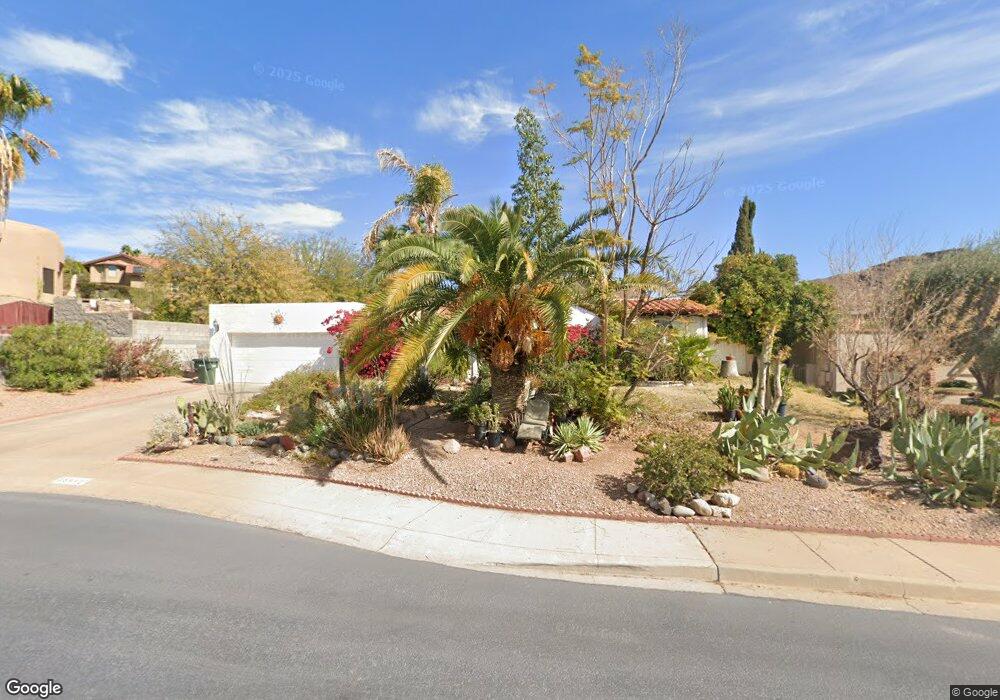
15443 N 9th Place Phoenix, AZ 85022
Moon Valley NeighborhoodEstimated Value: $657,659 - $743,000
--
Bed
3
Baths
2,730
Sq Ft
$261/Sq Ft
Est. Value
About This Home
This home is located at 15443 N 9th Place, Phoenix, AZ 85022 and is currently estimated at $711,915, approximately $260 per square foot. 15443 N 9th Place is a home located in Maricopa County with nearby schools including Hidden Hills Elementary School, Shea Middle School, and Shadow Mountain High School.
Ownership History
Date
Name
Owned For
Owner Type
Purchase Details
Closed on
Nov 19, 2009
Sold by
Putzig Bounsap K
Bought by
Putzig Christopher J
Current Estimated Value
Home Financials for this Owner
Home Financials are based on the most recent Mortgage that was taken out on this home.
Original Mortgage
$305,413
Outstanding Balance
$198,195
Interest Rate
4.88%
Mortgage Type
FHA
Estimated Equity
$513,720
Purchase Details
Closed on
Sep 16, 1996
Sold by
Buss Donald O
Bought by
Putzig Christopher J and Putzig Christopher
Home Financials for this Owner
Home Financials are based on the most recent Mortgage that was taken out on this home.
Original Mortgage
$130,000
Interest Rate
7.95%
Mortgage Type
New Conventional
Purchase Details
Closed on
Sep 20, 1994
Sold by
Fritz John Michael and Fritz Rosemarie A
Bought by
Buss Donald O
Home Financials for this Owner
Home Financials are based on the most recent Mortgage that was taken out on this home.
Original Mortgage
$151,200
Interest Rate
7.25%
Mortgage Type
New Conventional
Create a Home Valuation Report for This Property
The Home Valuation Report is an in-depth analysis detailing your home's value as well as a comparison with similar homes in the area
Home Values in the Area
Average Home Value in this Area
Purchase History
| Date | Buyer | Sale Price | Title Company |
|---|---|---|---|
| Putzig Christopher J | -- | Great American Title Agency | |
| Putzig Christopher J | $190,000 | First American Title | |
| Buss Donald O | $168,000 | Transamerica Title Ins Co |
Source: Public Records
Mortgage History
| Date | Status | Borrower | Loan Amount |
|---|---|---|---|
| Open | Putzig Christopher J | $305,413 | |
| Closed | Putzig Christopher J | $130,000 | |
| Previous Owner | Buss Donald O | $151,200 |
Source: Public Records
Tax History Compared to Growth
Tax History
| Year | Tax Paid | Tax Assessment Tax Assessment Total Assessment is a certain percentage of the fair market value that is determined by local assessors to be the total taxable value of land and additions on the property. | Land | Improvement |
|---|---|---|---|---|
| 2025 | $3,197 | $36,918 | -- | -- |
| 2024 | $3,044 | $35,160 | -- | -- |
| 2023 | $3,044 | $54,500 | $10,900 | $43,600 |
| 2022 | $3,015 | $40,530 | $8,100 | $32,430 |
| 2021 | $3,065 | $39,710 | $7,940 | $31,770 |
| 2020 | $2,960 | $37,160 | $7,430 | $29,730 |
| 2019 | $2,974 | $35,100 | $7,020 | $28,080 |
| 2018 | $2,865 | $35,150 | $7,030 | $28,120 |
| 2017 | $2,736 | $32,880 | $6,570 | $26,310 |
| 2016 | $2,693 | $30,720 | $6,140 | $24,580 |
| 2015 | $2,773 | $29,230 | $5,840 | $23,390 |
Source: Public Records
Map
Nearby Homes
- 815 E Coral Gables Dr
- 702 E Coral Gables Dr
- 1139 E Coral Gables Dr
- 426 E Carol Ann Way
- 14830 N 10th St
- 13837 N 12th St
- 13831 N 12th St
- 402 E Monte Cristo Ave
- 239 E Betty Elyse Ln Unit 93
- 1023 E Forest Hills Dr
- 1102 E Grandview Rd
- 14610 N 7th Place
- 1116 E Acoma Dr
- 15434 N 1st Place
- 15421 N Central Ave Unit 50
- 15 E Kathleen Rd
- 15850 N 15th Way
- 14211 N 10th St
- 1614 E Kathleen Rd
- 15427 N 2nd Ave
- 15435 N 9th Place
- 936 E Waltann Ln
- 933 E Waltann Ln
- 15429 N 9th Place
- 930 E Waltann Ln
- 930 E Waltann Ln Unit 31
- 934 E Beck Ln
- 1116 E Beck Ln
- 947 E Beck Ln
- 925 E Waltann Ln
- 926 E Beck Ln
- 945 E Beck Ln
- 924 E Waltann Ln
- 917 E Waltann Ln
- 937 E Beck Ln
- 918 E Beck Ln
- 948 E Beck Ln
- 908 E Waltann Ln
- 954 E Beck Ln