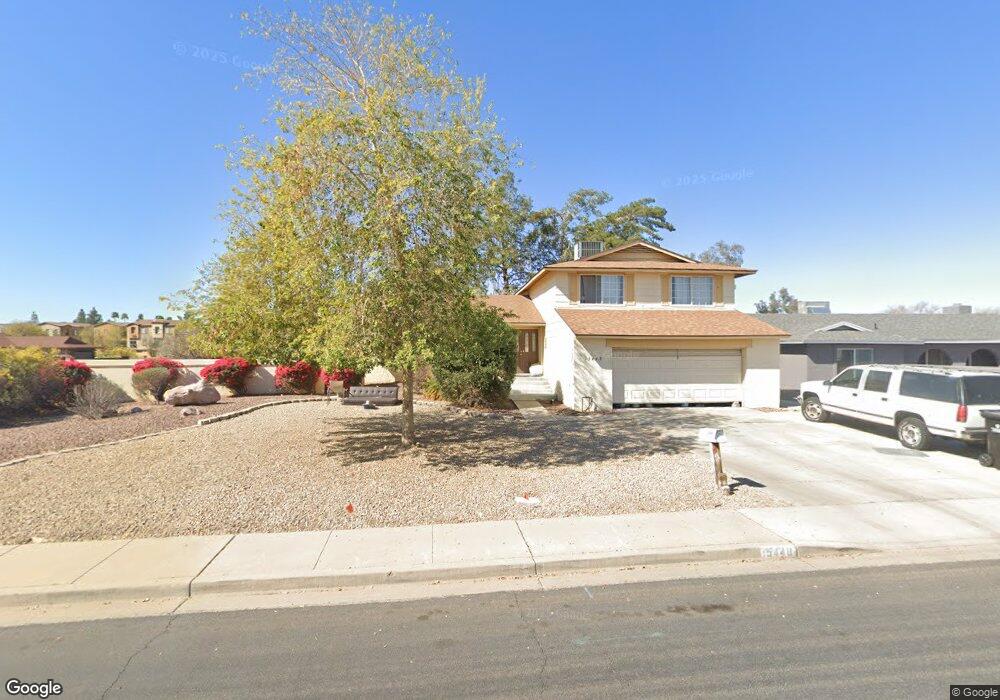
15448 N 32nd Ave Unit 2 Phoenix, AZ 85053
Deer Valley NeighborhoodEstimated Value: $430,103 - $520,000
4
Beds
3
Baths
2,344
Sq Ft
$203/Sq Ft
Est. Value
About This Home
This home is located at 15448 N 32nd Ave Unit 2, Phoenix, AZ 85053 and is currently estimated at $475,776, approximately $202 per square foot. 15448 N 32nd Ave Unit 2 is a home located in Maricopa County with nearby schools including Ironwood Elementary School, Desert Foothills Middle School, and Greenway High School.
Ownership History
Date
Name
Owned For
Owner Type
Purchase Details
Closed on
Feb 11, 2011
Sold by
Garcia Antonio and Garcia Patricia M
Bought by
Nahabedian Arthur H and Nahabedian Sonia
Current Estimated Value
Home Financials for this Owner
Home Financials are based on the most recent Mortgage that was taken out on this home.
Original Mortgage
$78,750
Outstanding Balance
$53,605
Interest Rate
4.67%
Mortgage Type
New Conventional
Estimated Equity
$422,171
Purchase Details
Closed on
Nov 13, 1997
Sold by
Walters Donald Boyd and Walters Marci
Bought by
Garcia Antonio and Garcia Patricia M
Home Financials for this Owner
Home Financials are based on the most recent Mortgage that was taken out on this home.
Original Mortgage
$115,286
Interest Rate
7.23%
Mortgage Type
New Conventional
Create a Home Valuation Report for This Property
The Home Valuation Report is an in-depth analysis detailing your home's value as well as a comparison with similar homes in the area
Home Values in the Area
Average Home Value in this Area
Purchase History
| Date | Buyer | Sale Price | Title Company |
|---|---|---|---|
| Nahabedian Arthur H | $105,000 | Driggs Title Agency Inc | |
| Garcia Antonio | $134,000 | Chicago Title Insurance Co |
Source: Public Records
Mortgage History
| Date | Status | Borrower | Loan Amount |
|---|---|---|---|
| Open | Nahabedian Arthur H | $78,750 | |
| Previous Owner | Garcia Antonio | $115,286 |
Source: Public Records
Tax History Compared to Growth
Tax History
| Year | Tax Paid | Tax Assessment Tax Assessment Total Assessment is a certain percentage of the fair market value that is determined by local assessors to be the total taxable value of land and additions on the property. | Land | Improvement |
|---|---|---|---|---|
| 2025 | $2,667 | $21,807 | -- | -- |
| 2024 | $2,619 | $20,768 | -- | -- |
| 2023 | $2,619 | $36,230 | $7,240 | $28,990 |
| 2022 | $2,533 | $28,130 | $5,620 | $22,510 |
| 2021 | $2,566 | $25,730 | $5,140 | $20,590 |
| 2020 | $2,502 | $24,120 | $4,820 | $19,300 |
| 2019 | $2,456 | $23,200 | $4,640 | $18,560 |
| 2018 | $2,392 | $21,480 | $4,290 | $17,190 |
| 2017 | $2,380 | $18,920 | $3,780 | $15,140 |
| 2016 | $2,336 | $17,820 | $3,560 | $14,260 |
| 2015 | $2,164 | $17,400 | $3,480 | $13,920 |
Source: Public Records
Map
Nearby Homes
- 3121 W Greenway Rd
- 15602 N 30th Dr
- 16044 N 35th Ave
- 3015 W Waltann Ln
- 3367 W Grandview Rd
- 3371 W Grandview Rd
- 16216 N 33rd Dr
- 3535 W Tierra Buena Ln Unit N156
- 14846 N 32nd Dr
- 3421 W Country Gables Dr
- 15022 N 35th Ave
- 16011 N 35th Dr
- 3601 W Tierra Buena Ln Unit 248
- 3601 W Tierra Buena Ln Unit 168
- 16050 N 35th Dr
- 3206 W Sequoia Way
- 3145 W Sandra Terrace
- 14814 N 35th Ave
- 3227 W Lisbon Ln
- 16412 N 33rd Ave
- 15454 N 32nd Ave
- 15447 N 32nd Dr
- 15453 N 32nd Dr
- 3174 W Betty Elyse Ln
- 3209 W Betty Elyse Ln
- 3201 W Betty Elyse Ln
- 15460 N 32nd Ave
- 15459 N 32nd Dr
- 3217 W Betty Elyse Ln
- 3173 W Waltann Ln
- 3169 W Betty Elyse Ln
- 3168 W Betty Elyse Ln
- 15601 N 32nd Dr
- 3167 W Waltann Ln
- 15466 N 32nd Ave
- 3163 W Betty Elyse Ln
- 15444 N 32nd Dr Unit 207
- 15444 N 32nd Dr
- 3162 W Betty Elyse Ln
- 3178 W Waltann Ln