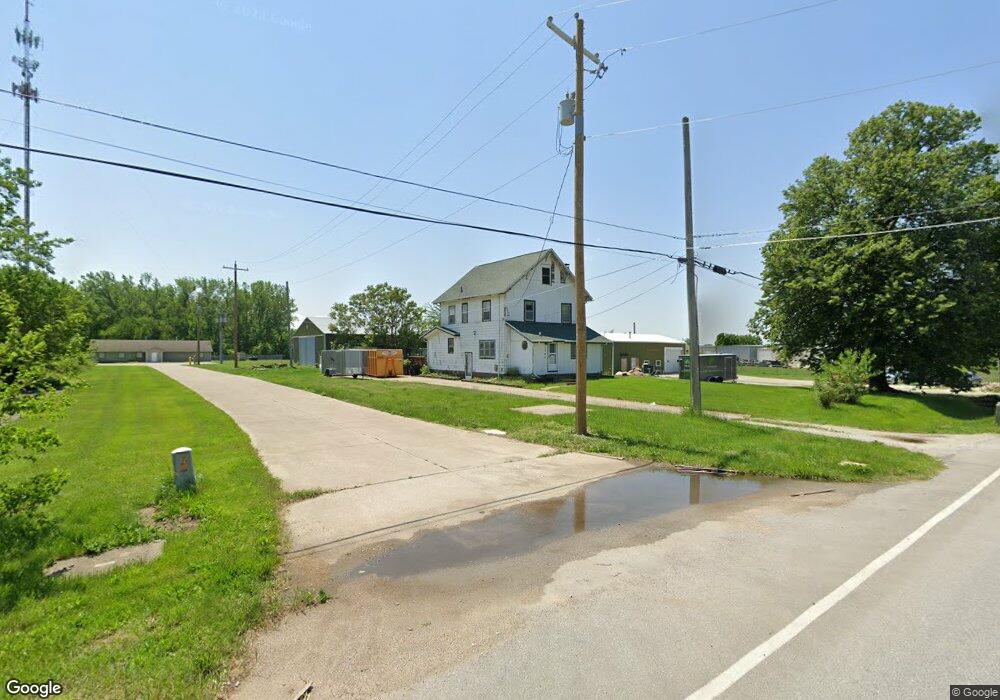
1545 NE 66th Ave Des Moines, IA 50313
Estimated Value: $202,000 - $314,000
3
Beds
1
Bath
1,364
Sq Ft
$189/Sq Ft
Est. Value
About This Home
This home is located at 1545 NE 66th Ave, Des Moines, IA 50313 and is currently estimated at $257,877, approximately $189 per square foot. 1545 NE 66th Ave is a home located in Polk County with nearby schools including Cornell Elementary School, Woodside Middle School, and Saydel High School.
Ownership History
Date
Name
Owned For
Owner Type
Purchase Details
Closed on
Dec 20, 2024
Sold by
Pettiecord Connie L and Pettiecord-Crandall Connie L
Bought by
Rasmussen Kyle R and Rasmussen Stephany C
Current Estimated Value
Purchase Details
Closed on
Jul 26, 2002
Sold by
Pettiecord Llyod and Pettiecord Connie
Bought by
Carnes Dale D
Purchase Details
Closed on
Jul 25, 2002
Sold by
Pettiecord Lloyd and Pettiecord Connie
Bought by
Carnes Dale D
Purchase Details
Closed on
Sep 1, 1999
Sold by
Pettiecord Lloyd H and Pettiecord Connie L
Bought by
Carnes Dale D
Home Financials for this Owner
Home Financials are based on the most recent Mortgage that was taken out on this home.
Original Mortgage
$78,300
Interest Rate
8%
Mortgage Type
Seller Take Back
Purchase Details
Closed on
Jan 13, 1997
Sold by
Iowa State Bank
Bought by
Pettiecord Lloyd and Pettiecord Connie
Create a Home Valuation Report for This Property
The Home Valuation Report is an in-depth analysis detailing your home's value as well as a comparison with similar homes in the area
Home Values in the Area
Average Home Value in this Area
Purchase History
| Date | Buyer | Sale Price | Title Company |
|---|---|---|---|
| Rasmussen Kyle R | $120,000 | None Listed On Document | |
| Rasmussen Kyle R | $120,000 | None Listed On Document | |
| Carnes Dale D | $68,027 | -- | |
| Carnes Dale D | $71,737 | -- | |
| Carnes Dale D | $80,000 | -- | |
| Pettiecord Lloyd | $49,500 | -- |
Source: Public Records
Mortgage History
| Date | Status | Borrower | Loan Amount |
|---|---|---|---|
| Previous Owner | Carnes Dale D | $78,300 | |
| Closed | Carnes Dale D | $0 |
Source: Public Records
Tax History Compared to Growth
Tax History
| Year | Tax Paid | Tax Assessment Tax Assessment Total Assessment is a certain percentage of the fair market value that is determined by local assessors to be the total taxable value of land and additions on the property. | Land | Improvement |
|---|---|---|---|---|
| 2025 | $2,246 | $183,300 | $60,500 | $122,800 |
| 2024 | $2,246 | $164,000 | $54,000 | $110,000 |
| 2023 | $2,260 | $164,000 | $54,000 | $110,000 |
| 2022 | $2,222 | $138,700 | $46,600 | $92,100 |
| 2021 | $2,104 | $138,700 | $46,600 | $92,100 |
| 2020 | $2,076 | $124,100 | $42,000 | $82,100 |
| 2019 | $1,892 | $124,100 | $42,000 | $82,100 |
| 2018 | $1,854 | $108,800 | $36,000 | $72,800 |
| 2017 | $1,776 | $108,800 | $36,000 | $72,800 |
| 2016 | $1,732 | $101,600 | $33,000 | $68,600 |
| 2015 | $1,732 | $101,600 | $33,000 | $68,600 |
| 2014 | $1,670 | $99,400 | $31,600 | $67,800 |
Source: Public Records
Map
Nearby Homes
- 6537 NE 11th Ct
- 6545 NE 11th Ct
- 6565 NE 11th Ct
- 6557 NE 11th Ct
- 6417 NE 11th Ct
- 6570 NE 11th Ct
- 6538 NE 11th Ct
- 6562 NE 11th Ct
- 6546 NE 11th Ct
- 6554 NE 11th Ct
- 1064 NE 64th Ave
- 3901 NE 70th Ave
- Chester Plan at Greens at Woodland Hills
- Cedar Plan at Greens at Woodland Hills
- Jasmine Plan at Greens at Woodland Hills
- Forrester Plan at Greens at Woodland Hills
- Hampton Plan at Greens at Woodland Hills
- Melrose Plan at Greens at Woodland Hills
- Lansing Plan at Greens at Woodland Hills
- Fraser Plan at Greens at Woodland Hills
- 1541 NE 66th Ave
- 1521 NE 66th Ave
- 1467 NE 66th Ave
- 1453 NE 66th Ave
- 6548 NE 17th Ct
- 1439 NE 66th Ave
- 1665 NE 66th Ave
- 6561 NE 14th St
- 6642 NE 17th St
- 6604 NE 17th St
- 6620 NE 17th St
- 6652 NE 17th St
- 6615 NE 14th St
- 6670 NE 17th St
- 6686 NE 17th St
- 6625 NE 17th St
- 6520 NE 17th Ct
- 6560 NE 17th Ct
- 1587 NE 67th Place
- 6645 NE 17th St