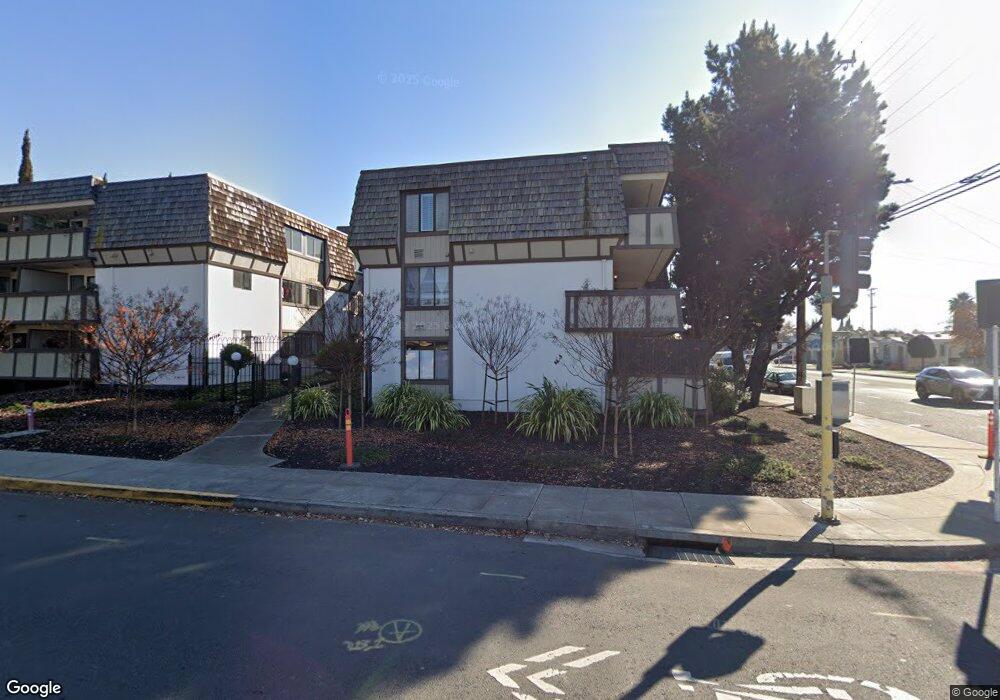
1550 Bancroft Ave Unit 112 San Leandro, CA 94577
Assumption Parish NeighborhoodEstimated Value: $524,000 - $575,000
2
Beds
2
Baths
1,352
Sq Ft
$401/Sq Ft
Est. Value
About This Home
This home is located at 1550 Bancroft Ave Unit 112, San Leandro, CA 94577 and is currently estimated at $542,033, approximately $400 per square foot. 1550 Bancroft Ave Unit 112 is a home located in Alameda County with nearby schools including McKinley Elementary School, Bancroft Middle School, and San Leandro High School.
Ownership History
Date
Name
Owned For
Owner Type
Purchase Details
Closed on
May 21, 2021
Sold by
Chen Yue and Ni Hongyan
Bought by
Wong Nicholas Patrick
Current Estimated Value
Home Financials for this Owner
Home Financials are based on the most recent Mortgage that was taken out on this home.
Original Mortgage
$575,000
Outstanding Balance
$519,456
Interest Rate
2.9%
Mortgage Type
VA
Estimated Equity
$22,577
Purchase Details
Closed on
Mar 10, 2015
Sold by
Mcdonough Robert
Bought by
Chen Yue and Ni Hongyan
Home Financials for this Owner
Home Financials are based on the most recent Mortgage that was taken out on this home.
Original Mortgage
$210,000
Interest Rate
3.61%
Mortgage Type
New Conventional
Purchase Details
Closed on
Dec 5, 2012
Sold by
Kaplan Douglas
Bought by
Mcdonough Robert
Purchase Details
Closed on
Mar 20, 1995
Sold by
Basta Janet Louise and Lichtenberger May M
Bought by
Adamo Vincent W
Create a Home Valuation Report for This Property
The Home Valuation Report is an in-depth analysis detailing your home's value as well as a comparison with similar homes in the area
Home Values in the Area
Average Home Value in this Area
Purchase History
| Date | Buyer | Sale Price | Title Company |
|---|---|---|---|
| Wong Nicholas Patrick | $575,000 | Chicago Title Company | |
| Chen Yue | $344,000 | Placer Title Company | |
| Mcdonough Robert | -- | None Available | |
| Adamo Vincent W | $150,000 | Old Republic Title Company |
Source: Public Records
Mortgage History
| Date | Status | Borrower | Loan Amount |
|---|---|---|---|
| Open | Wong Nicholas Patrick | $575,000 | |
| Previous Owner | Chen Yue | $210,000 |
Source: Public Records
Tax History Compared to Growth
Tax History
| Year | Tax Paid | Tax Assessment Tax Assessment Total Assessment is a certain percentage of the fair market value that is determined by local assessors to be the total taxable value of land and additions on the property. | Land | Improvement |
|---|---|---|---|---|
| 2025 | $8,273 | $447,093 | $189,423 | $432,968 |
| 2024 | $8,273 | $603,190 | $185,710 | $424,480 |
| 2023 | $8,208 | $598,230 | $182,070 | $416,160 |
| 2022 | $7,978 | $579,500 | $178,500 | $408,000 |
| 2021 | $5,348 | $374,942 | $114,582 | $267,360 |
| 2020 | $5,193 | $378,027 | $113,408 | $264,619 |
| 2019 | $5,042 | $370,618 | $111,185 | $259,433 |
| 2018 | $4,900 | $363,353 | $109,006 | $254,347 |
| 2017 | $4,819 | $356,228 | $106,868 | $249,360 |
| 2016 | $4,570 | $349,245 | $104,773 | $244,472 |
| 2015 | $3,042 | $211,261 | $42,252 | $169,009 |
| 2014 | $3,014 | $207,123 | $41,424 | $165,699 |
Source: Public Records
Map
Nearby Homes
- 1550 Bancroft Ave Unit 112
- 1550 Bancroft Ave Unit 111
- 348 Maud Ave
- 400 Joaquin Ave
- 775 Elsie Ave
- 856 Dolores Ave
- 414 Callan Ave
- 65 Thornton St
- 2147 Trombas Ave
- 1468 Grand Ave Unit 39
- 1468 Grand Ave Unit 9
- 1468 Grand Ave Unit 21
- 851 Kenyon Ave
- 869 Lee Ave
- 2378 Cheshire Place
- 821 Lee Ave
- 972 Collier Dr
- 2062 Washington Ave
- 1854 Hays St
- 1599 Hays St Unit 306
- 1550 Bancroft Ave Unit 322
- 1550 Bancroft Ave Unit 331
- 1550 Bancroft Ave Unit 422
- 1550 Bancroft Ave Unit 421
- 1550 Bancroft Ave Unit 332
- 1550 Bancroft Ave Unit 232
- 1550 Bancroft Ave Unit 132
- 1550 Bancroft Ave Unit 121
- 1550 Bancroft Ave Unit 213
- 1550 Bancroft Ave Unit 411
- 1550 Bancroft Ave Unit 222
- 1550 Bancroft Ave Unit 212
- 1550 Bancroft Ave Unit 231
- 1550 Bancroft Ave Unit 312
- 1550 Bancroft Ave Unit 131
- 1550 Bancroft Ave Unit 221
- 1550 Bancroft Ave Unit 223
- 1550 Bancroft Ave
- 1550 Bancroft Ave Unit 122
- 1550 Bancroft Ave Unit 123