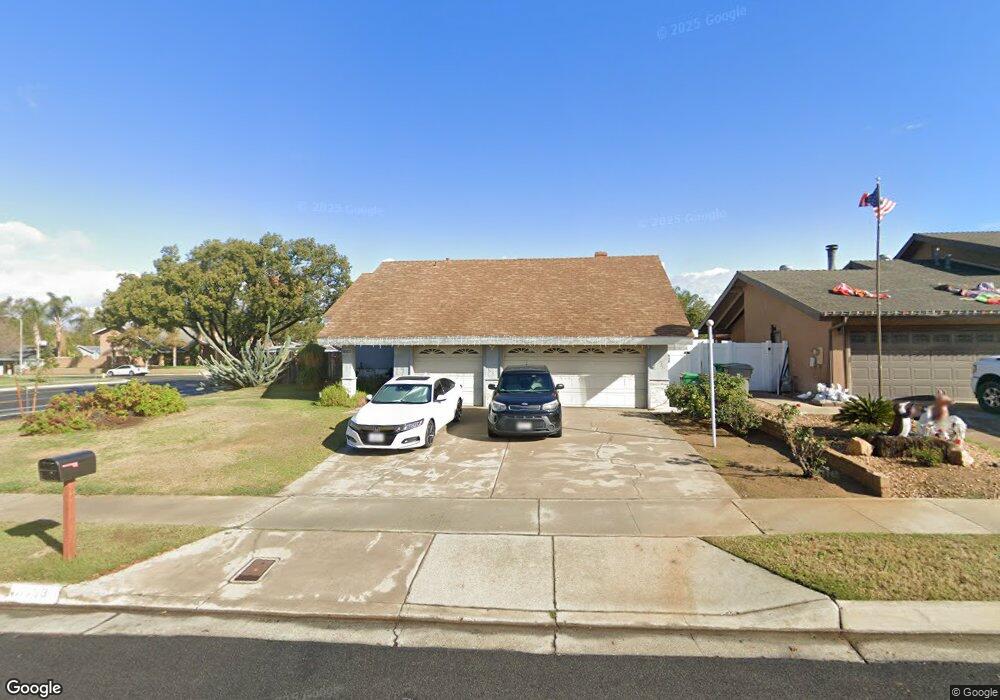
1553 Granada Ave Corona, CA 92880
North Corona NeighborhoodEstimated Value: $769,989 - $882,000
5
Beds
3
Baths
2,247
Sq Ft
$371/Sq Ft
Est. Value
About This Home
This home is located at 1553 Granada Ave, Corona, CA 92880 and is currently estimated at $833,747, approximately $371 per square foot. 1553 Granada Ave is a home located in Riverside County with nearby schools including George Washington Elementary, Auburndale Intermediate, and Norco High School.
Ownership History
Date
Name
Owned For
Owner Type
Purchase Details
Closed on
Dec 29, 2014
Sold by
Reid John S and Reid Mary Carolyn
Bought by
Reid Trust
Current Estimated Value
Purchase Details
Closed on
Nov 23, 2013
Sold by
Reid John S and Reid Mary Carolyn
Bought by
Reid John S and Reid Mary Carolyn
Home Financials for this Owner
Home Financials are based on the most recent Mortgage that was taken out on this home.
Original Mortgage
$122,379
Interest Rate
4.08%
Mortgage Type
New Conventional
Purchase Details
Closed on
Aug 13, 1997
Sold by
Reid John S
Bought by
Reid John S and Reid Carolyn
Home Financials for this Owner
Home Financials are based on the most recent Mortgage that was taken out on this home.
Original Mortgage
$86,000
Interest Rate
7.34%
Mortgage Type
Purchase Money Mortgage
Create a Home Valuation Report for This Property
The Home Valuation Report is an in-depth analysis detailing your home's value as well as a comparison with similar homes in the area
Home Values in the Area
Average Home Value in this Area
Purchase History
| Date | Buyer | Sale Price | Title Company |
|---|---|---|---|
| Reid Trust | -- | None Available | |
| Reid John S | -- | None Available | |
| Reid John S | -- | Chicago Title Co |
Source: Public Records
Mortgage History
| Date | Status | Borrower | Loan Amount |
|---|---|---|---|
| Closed | Reid John S | $122,379 | |
| Closed | Reid John S | $86,000 |
Source: Public Records
Tax History Compared to Growth
Tax History
| Year | Tax Paid | Tax Assessment Tax Assessment Total Assessment is a certain percentage of the fair market value that is determined by local assessors to be the total taxable value of land and additions on the property. | Land | Improvement |
|---|---|---|---|---|
| 2025 | $1,563 | $144,946 | $27,715 | $117,231 |
| 2023 | $1,563 | $139,320 | $26,640 | $112,680 |
| 2022 | $1,511 | $136,589 | $26,118 | $110,471 |
| 2021 | $1,480 | $133,911 | $25,606 | $108,305 |
| 2020 | $1,463 | $132,539 | $25,344 | $107,195 |
| 2019 | $1,429 | $129,942 | $24,848 | $105,094 |
| 2018 | $1,397 | $127,395 | $24,362 | $103,033 |
| 2017 | $1,362 | $124,898 | $23,885 | $101,013 |
| 2016 | $1,347 | $122,450 | $23,417 | $99,033 |
| 2015 | $1,318 | $120,613 | $23,066 | $97,547 |
| 2014 | $1,271 | $118,252 | $22,615 | $95,637 |
Source: Public Records
Map
Nearby Homes
- 1142 Country Club Ln
- 1530 Greenbriar Ave
- 1474 Greenbriar Ave
- 936 Auburndale St
- 909 Nottingham Dr
- 1966 Trotter Trail
- 1826 Chesapeake Way
- 1841 Chesapeake Way
- 1868 Kingsford Dr
- 3344 Dales Dr
- 938 Amherst St
- 2374 Corydon Ave
- 12866 Auburn Dr
- 12872 Auburn Dr
- 12868 Auburn Dr
- 12823 Denali Way
- 2151 Bowdoin St
- 1281 Carriage Ln
- 1118 Fallbrook Dr
- 1017 Savi Dr Unit 103
- 1545 Granada Ave
- 1101 Country Club Ln
- 1081 Country Club Ln
- 1537 Granada Ave
- 1109 Country Club Ln
- 1092 Country Club Ln
- 1098 Country Club Ln
- 1102 Norcrest St
- 1566 Brookdale Dr
- 1086 Elmhurst Dr
- 1086 Country Club Ln
- 1075 Country Club Ln
- 1117 Country Club Ln
- 1529 Granada Ave
- 1110 Country Club Ln
- 1080 Country Club Ln
- 1614 Melrose Dr
- 1110 Norcrest St
- 1558 Brookdale Dr
- 1080 Elmhurst Dr