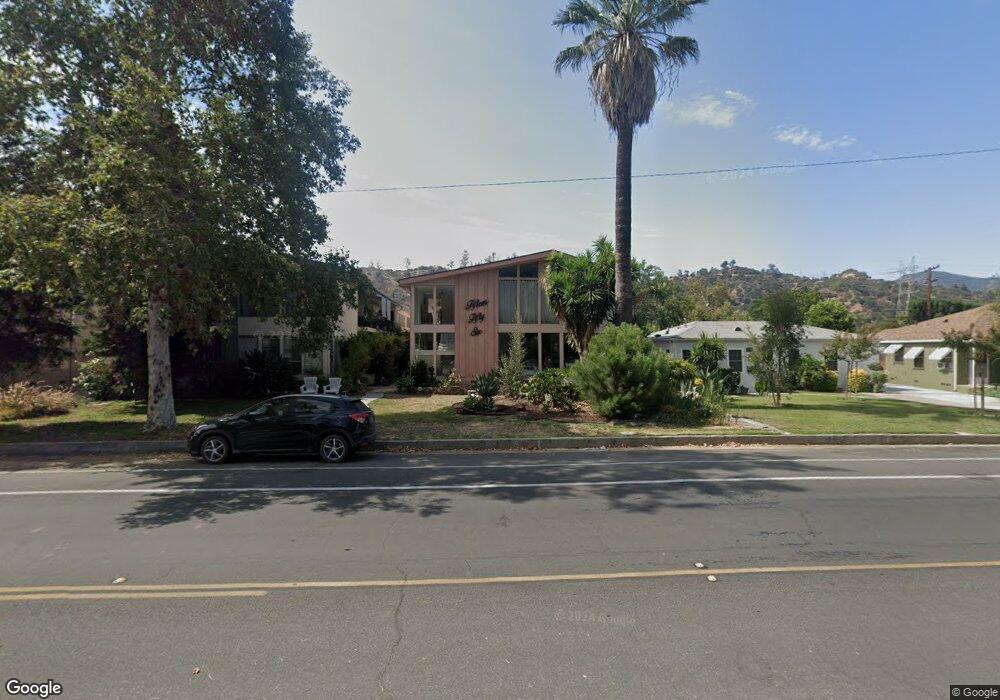
1556 Riverside Dr Unit 1 Glendale, CA 91201
Riverside Rancho NeighborhoodEstimated Value: $690,000 - $771,000
2
Beds
2
Baths
1,221
Sq Ft
$585/Sq Ft
Est. Value
About This Home
This home is located at 1556 Riverside Dr Unit 1, Glendale, CA 91201 and is currently estimated at $714,370, approximately $585 per square foot. 1556 Riverside Dr Unit 1 is a home located in Los Angeles County with nearby schools including Balboa Elementary School, Eleanor J. Toll Middle School, and Herbert Hoover High School.
Ownership History
Date
Name
Owned For
Owner Type
Purchase Details
Closed on
Jun 24, 2003
Sold by
Georges Dany and Georges Caroline
Bought by
Helpinstill Nancy Caroline
Current Estimated Value
Home Financials for this Owner
Home Financials are based on the most recent Mortgage that was taken out on this home.
Original Mortgage
$196,250
Outstanding Balance
$82,153
Interest Rate
5.17%
Mortgage Type
Purchase Money Mortgage
Estimated Equity
$632,217
Purchase Details
Closed on
Jul 31, 2002
Sold by
Harris Kauhane and Estate Of David L Harris
Bought by
Georges Dany
Home Financials for this Owner
Home Financials are based on the most recent Mortgage that was taken out on this home.
Original Mortgage
$164,000
Interest Rate
7.5%
Purchase Details
Closed on
Jun 5, 1999
Sold by
Harris David L and Enriquez Alfredo
Bought by
Harris David L and Enriquez Alfredo
Purchase Details
Closed on
Nov 4, 1993
Sold by
Walters Henry
Bought by
Harris David L
Create a Home Valuation Report for This Property
The Home Valuation Report is an in-depth analysis detailing your home's value as well as a comparison with similar homes in the area
Home Values in the Area
Average Home Value in this Area
Purchase History
| Date | Buyer | Sale Price | Title Company |
|---|---|---|---|
| Helpinstill Nancy Caroline | $255,000 | Fatcola | |
| Georges Dany | $207,500 | Southland Title | |
| Harris David L | -- | -- | |
| Harris David L | $107,500 | Gateway Title Company |
Source: Public Records
Mortgage History
| Date | Status | Borrower | Loan Amount |
|---|---|---|---|
| Open | Helpinstill Nancy Caroline | $196,250 | |
| Previous Owner | Georges Dany | $164,000 |
Source: Public Records
Tax History Compared to Growth
Tax History
| Year | Tax Paid | Tax Assessment Tax Assessment Total Assessment is a certain percentage of the fair market value that is determined by local assessors to be the total taxable value of land and additions on the property. | Land | Improvement |
|---|---|---|---|---|
| 2025 | $4,006 | $362,534 | $126,527 | $236,007 |
| 2024 | $4,006 | $355,427 | $124,047 | $231,380 |
| 2023 | $3,916 | $348,459 | $121,615 | $226,844 |
| 2022 | $3,846 | $341,628 | $119,231 | $222,397 |
| 2021 | $3,776 | $334,931 | $116,894 | $218,037 |
| 2019 | $3,632 | $324,999 | $113,428 | $211,571 |
| 2018 | $3,573 | $318,627 | $111,204 | $207,423 |
| 2016 | $3,402 | $306,256 | $106,887 | $199,369 |
| 2015 | $3,334 | $301,657 | $105,282 | $196,375 |
| 2014 | $3,309 | $295,749 | $103,220 | $192,529 |
Source: Public Records
Map
Nearby Homes
- 1542 Riverside Dr Unit G
- 1533 Rancho Ave
- 1744 Stanton Ave
- 324 Thompson Ave
- 329 Thompson Ave
- 611 Davis Ave
- 331 Allen Ave
- 252 W Elm Ave
- Plan 2 at Pickwick Lane
- Plan 1 at Pickwick Lane
- Plan 3 at Pickwick Lane
- Plan 3X at Pickwick Lane
- 139 Bridle Dr
- 142 Bridle Dr
- 150 Bridle Dr
- 149 Bridle Dr
- 333 W Alameda Ave Unit 103
- 365 W Alameda Ave Unit 304
- 1321 W Morningside Dr
- 1041 Ruberta Ave
- 1556 Riverside Dr Unit C
- 1556 Riverside Dr Unit A
- 1556 Riverside Dr Unit E
- 1556 Riverside Dr Unit D
- 1556 Riverside Dr Unit 5
- 1556 Riverside Dr Unit 2
- 1556 Riverside Dr Unit 3
- 1556 Riverside Dr Unit 4
- 1550 Riverside Dr Unit E
- 1550 Riverside Dr Unit C
- 1550 Riverside Dr Unit B
- 1550 Riverside Dr Unit A
- 1550 Riverside Dr Unit D
- 1558 Riverside Dr
- 1564 Riverside Dr
- 1548 Riverside Dr Unit F
- 1548 Riverside Dr Unit G
- 1548 Riverside Dr Unit D
- 1548 Riverside Dr Unit C
- 1548 Riverside Dr Unit B