Y
Landlord's Agent in 2025
Yang Peng
Libra Realty, LLC
(703) 297-6443
1 in this area
9 Total Sales

Estimated Value: $622,033 - $648,000
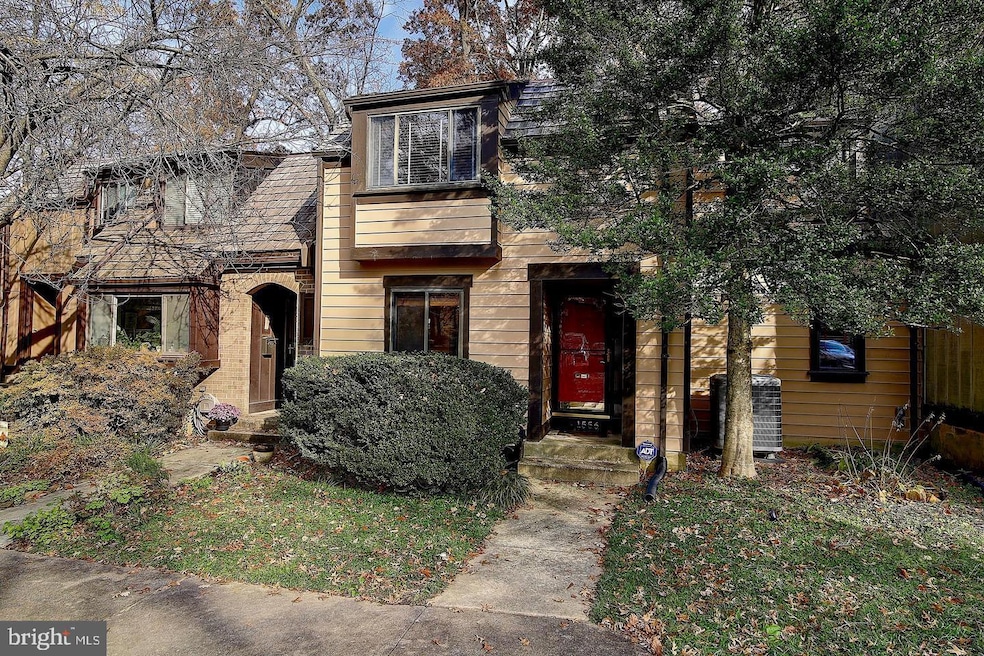
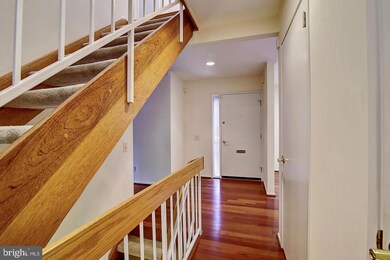
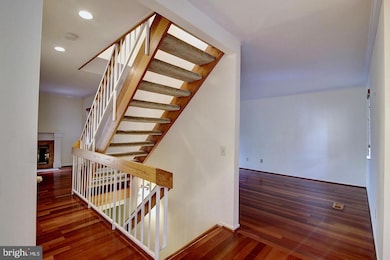
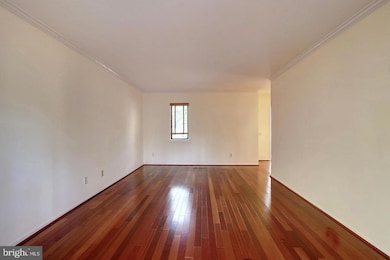
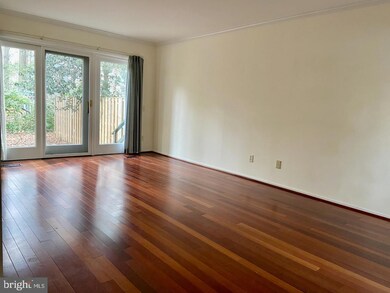
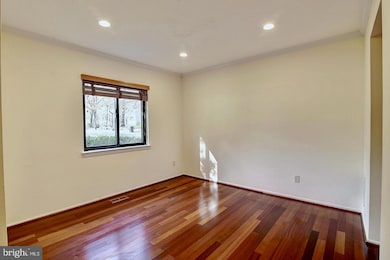
Wonderful Location! Updated and well maintained spacious 3BR /2.5 BA Townhome with beautiful Brazilian cherry floors, Schrock kitchen cabinets with granite countertops, and upscale stainless appliances. All three bedrooms with plenty of sunlight and large closets. Ample basement space includes an acoustic studio and separate laundry! The large living room leads to a backdoor patio overlooking woods. Access to all Reston amenities including pools and tennis courts. Less than 1.5 miles to Silver Line Metro/Reston East Station. Mins to Reston Town Center, Dulles Airport, and Tysons Corner.
Last Agent to Rent the Property
(703) 297-6443 peng_yang@hotmail.com Libra Realty, LLC License #0225209569 Listed on: 09/01/2025
Last Renter's Agent
Non Member Member
beta@mris.net Metropolitan Regional Information Systems, Inc.
| Date | Buyer | Sale Price | Title Company |
|---|---|---|---|
| Maple Orchard Properties Llc | -- | None Listed On Document | |
| Maple Orchard Properties Llc | -- | None Listed On Document | |
| Yu Dingshin | $500,000 | Icon Title | |
| Yu Dingshin | $500,000 | Icon Title | |
| Yu Dingshin | $500,000 | First American Mortgage Soluti | |
| Maffuccio Christopher | $430,000 | Champion Title & Stlmnts Inc | |
| Shackford John S | $145,000 | -- |
| Date | Status | Borrower | Loan Amount |
|---|---|---|---|
| Previous Owner | Maffuccio Christopher | $430,000 | |
| Previous Owner | Shackford John S | $119,000 |
| Date | Event | Price | List to Sale | Price per Sq Ft | Prior Sale |
|---|---|---|---|---|---|
| 10/25/2025 10/25/25 | Rented | $3,100 | 0.0% | -- | |
| 10/01/2025 10/01/25 | Price Changed | $3,100 | -3.1% | $2 / Sq Ft | |
| 09/01/2025 09/01/25 | For Rent | $3,200 | +3.2% | -- | |
| 04/18/2024 04/18/24 | Rented | $3,100 | 0.0% | -- | |
| 03/16/2024 03/16/24 | Under Contract | -- | -- | -- | |
| 02/28/2024 02/28/24 | For Rent | $3,100 | +17.0% | -- | |
| 02/27/2022 02/27/22 | Rented | $2,650 | 0.0% | -- | |
| 02/20/2022 02/20/22 | Under Contract | -- | -- | -- | |
| 02/12/2022 02/12/22 | For Rent | $2,650 | 0.0% | -- | |
| 01/31/2022 01/31/22 | Sold | $500,000 | -1.0% | $271 / Sq Ft | View Prior Sale |
| 01/11/2022 01/11/22 | Pending | -- | -- | -- | |
| 01/04/2022 01/04/22 | Price Changed | $505,000 | -1.9% | $274 / Sq Ft | |
| 12/12/2021 12/12/21 | For Sale | $515,000 | +3.0% | $279 / Sq Ft | |
| 12/11/2021 12/11/21 | Off Market | $500,000 | -- | -- | |
| 10/14/2021 10/14/21 | Price Changed | $515,000 | -1.0% | $279 / Sq Ft | |
| 10/07/2021 10/07/21 | For Sale | $520,000 | 0.0% | $282 / Sq Ft | |
| 02/15/2019 02/15/19 | Rented | $2,350 | -2.0% | -- | |
| 01/16/2019 01/16/19 | Under Contract | -- | -- | -- | |
| 01/08/2019 01/08/19 | For Rent | $2,399 | -0.5% | -- | |
| 08/01/2017 08/01/17 | Rented | $2,410 | +0.4% | -- | |
| 07/15/2017 07/15/17 | Under Contract | -- | -- | -- | |
| 06/27/2017 06/27/17 | For Rent | $2,400 | 0.0% | -- | |
| 07/22/2016 07/22/16 | Sold | $430,000 | 0.0% | $260 / Sq Ft | View Prior Sale |
| 06/15/2016 06/15/16 | Pending | -- | -- | -- | |
| 06/11/2016 06/11/16 | For Sale | $430,000 | -- | $260 / Sq Ft |
| Year | Tax Paid | Tax Assessment Tax Assessment Total Assessment is a certain percentage of the fair market value that is determined by local assessors to be the total taxable value of land and additions on the property. | Land | Improvement |
|---|---|---|---|---|
| 2025 | $5,957 | $586,380 | $130,000 | $456,380 |
| 2024 | $5,957 | $494,170 | $120,000 | $374,170 |
| 2023 | $5,633 | $479,200 | $120,000 | $359,200 |
| 2022 | $5,862 | $492,390 | $120,000 | $372,390 |
| 2021 | $5,258 | $430,840 | $110,000 | $320,840 |
| 2020 | $4,852 | $394,350 | $100,000 | $294,350 |
| 2019 | $5,167 | $419,950 | $100,000 | $319,950 |
| 2018 | $4,557 | $396,250 | $100,000 | $296,250 |
| 2017 | $4,682 | $387,620 | $100,000 | $287,620 |
| 2016 | $4,707 | $390,430 | $100,000 | $290,430 |
| 2015 | $4,411 | $379,260 | $100,000 | $279,260 |
| 2014 | $4,401 | $379,260 | $100,000 | $279,260 |
Y
Landlord's Agent in 2025
Yang Peng
Libra Realty, LLC
(703) 297-6443
1 in this area
9 Total Sales
N
Tenant's Agent in 2025
Non Member Member
Metropolitan Regional Information Systems

Seller's Agent in 2022
Joshua Herron
Pearson Smith Realty, LLC
(571) 439-5510
1 in this area
27 Total Sales
Buyer's Agent in 2022
Alexis Richards
Compass
(757) 635-7274
22 Total Sales
Buyer's Agent in 2019
Rakesh Kumar
Samson Properties
(703) 475-6673
48 Total Sales
Seller's Agent in 2017
Marc Haakonson
Real Property Management Pros
(703) 956-5125
24 Total Sales
Source: Bright MLS
MLS Number: VAFX2264660
APN: 0181-05020058
Disclaimer: Certain information contained herein is derived from information provided by parties other than Homes.com. All information provided is deemed reliable, but is not guaranteed to be accurate and should be independently verified.
![]() The data relating to real estate for sale on this website appears in part through the BRIGHT Internet Data Exchange program, a voluntary cooperative exchange of property listing data between licensed real estate brokerage firms, and is provided by BRIGHT through a licensing agreement.
The data relating to real estate for sale on this website appears in part through the BRIGHT Internet Data Exchange program, a voluntary cooperative exchange of property listing data between licensed real estate brokerage firms, and is provided by BRIGHT through a licensing agreement.
Listing information is from various brokers who participate in the Bright MLS IDX program and not all listings may be visible on the site.
The property information being provided on or through the website is for the personal, non-commercial use of consumers and such information may not be used for any purpose other than to identify prospective properties consumers may be interested in purchasing.
Some properties which appear for sale on the website may no longer be available because they are for instance, under contract, sold or are no longer being offered for sale.
Property information displayed is deemed reliable but is not guaranteed.
Copyright 2025 Bright MLS, Inc.