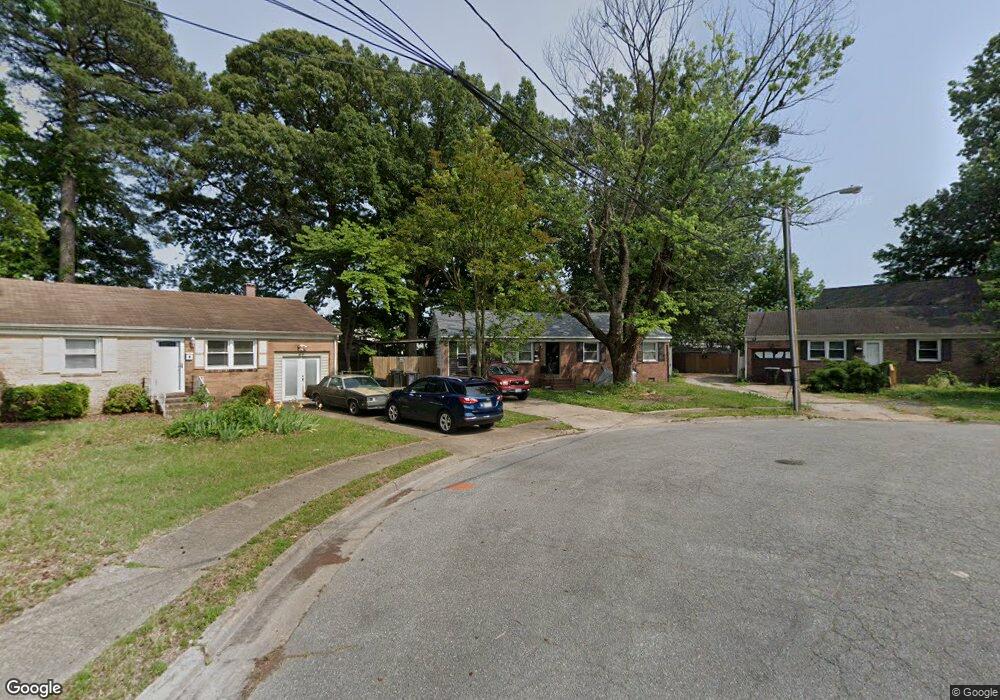
1559 Mark Dr Hampton, VA 23661
Briarfield NeighborhoodEstimated Value: $241,000 - $262,411
3
Beds
2
Baths
1,272
Sq Ft
$198/Sq Ft
Est. Value
About This Home
This home is located at 1559 Mark Dr, Hampton, VA 23661 and is currently estimated at $251,353, approximately $197 per square foot. 1559 Mark Dr is a home located in Hampton City with nearby schools including Aberdeen Elementary School, Cesar Tarrant Middle School, and Bethel High School.
Ownership History
Date
Name
Owned For
Owner Type
Purchase Details
Closed on
Aug 7, 2019
Sold by
Moody David E
Bought by
Machner John C
Current Estimated Value
Purchase Details
Closed on
Aug 29, 2018
Sold by
Moody Jann
Bought by
Moody David E
Purchase Details
Closed on
Oct 16, 1998
Sold by
Sec Hud
Bought by
Moody David R
Home Financials for this Owner
Home Financials are based on the most recent Mortgage that was taken out on this home.
Original Mortgage
$75,000
Interest Rate
6.8%
Create a Home Valuation Report for This Property
The Home Valuation Report is an in-depth analysis detailing your home's value as well as a comparison with similar homes in the area
Home Values in the Area
Average Home Value in this Area
Purchase History
| Date | Buyer | Sale Price | Title Company |
|---|---|---|---|
| Machner John C | -- | None Available | |
| Moody David E | -- | None Available | |
| Moody David R | $83,000 | -- |
Source: Public Records
Mortgage History
| Date | Status | Borrower | Loan Amount |
|---|---|---|---|
| Previous Owner | Moody David R | $75,000 |
Source: Public Records
Tax History
| Year | Tax Paid | Tax Assessment Tax Assessment Total Assessment is a certain percentage of the fair market value that is determined by local assessors to be the total taxable value of land and additions on the property. | Land | Improvement |
|---|---|---|---|---|
| 2025 | $2,721 | $246,500 | $62,400 | $184,100 |
| 2024 | $2,337 | $203,200 | $62,400 | $140,800 |
| 2023 | $2,002 | $172,600 | $52,800 | $119,800 |
| 2022 | $1,861 | $157,700 | $43,200 | $114,500 |
| 2021 | $1,851 | $138,800 | $40,600 | $98,200 |
| 2020 | $1,680 | $135,500 | $40,600 | $94,900 |
| 2019 | $1,658 | $133,700 | $40,600 | $93,100 |
| 2018 | $1,754 | $133,900 | $40,600 | $93,300 |
| 2017 | $1,754 | $0 | $0 | $0 |
| 2016 | $1,754 | $133,900 | $0 | $0 |
| 2015 | $1,754 | $0 | $0 | $0 |
| 2014 | $1,873 | $139,600 | $40,600 | $99,000 |
Source: Public Records
Map
Nearby Homes
Your Personal Tour Guide
Ask me questions while you tour the home.