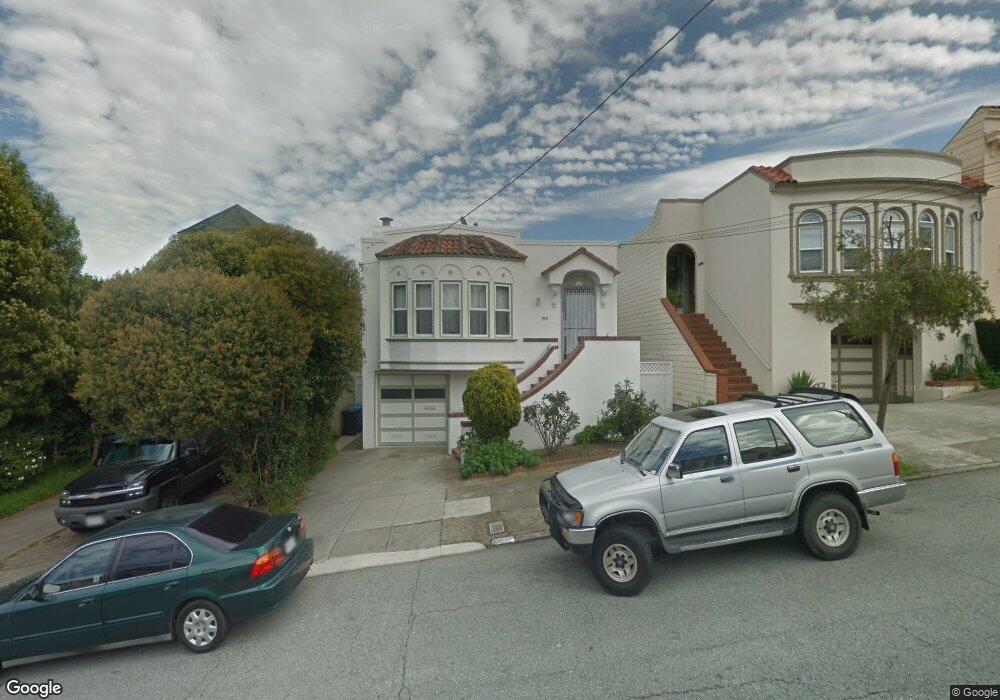
156 Ashton Ave San Francisco, CA 94112
Ingleside NeighborhoodEstimated Value: $1,122,000 - $1,611,000
--
Bed
2
Baths
2,017
Sq Ft
$681/Sq Ft
Est. Value
About This Home
This home is located at 156 Ashton Ave, San Francisco, CA 94112 and is currently estimated at $1,374,486, approximately $681 per square foot. 156 Ashton Ave is a home located in San Francisco County with nearby schools including Commodore Sloat Elementary School, Aptos Middle School, and Leadership High School.
Ownership History
Date
Name
Owned For
Owner Type
Purchase Details
Closed on
Jun 9, 2018
Sold by
Woo Yu Man and Hu Jin E
Bought by
Woo David and Woo Wanda
Current Estimated Value
Purchase Details
Closed on
Apr 4, 2002
Sold by
Christopherson Henry E and Christopherson Thelma D
Bought by
Woo Yu Man and Hu Jin E
Home Financials for this Owner
Home Financials are based on the most recent Mortgage that was taken out on this home.
Original Mortgage
$300,000
Outstanding Balance
$120,449
Interest Rate
6.37%
Estimated Equity
$1,254,037
Create a Home Valuation Report for This Property
The Home Valuation Report is an in-depth analysis detailing your home's value as well as a comparison with similar homes in the area
Home Values in the Area
Average Home Value in this Area
Purchase History
| Date | Buyer | Sale Price | Title Company |
|---|---|---|---|
| Woo David | -- | None Available | |
| Woo Yu Man | $495,000 | Old Republic Title Company |
Source: Public Records
Mortgage History
| Date | Status | Borrower | Loan Amount |
|---|---|---|---|
| Open | Woo Yu Man | $300,000 |
Source: Public Records
Tax History Compared to Growth
Tax History
| Year | Tax Paid | Tax Assessment Tax Assessment Total Assessment is a certain percentage of the fair market value that is determined by local assessors to be the total taxable value of land and additions on the property. | Land | Improvement |
|---|---|---|---|---|
| 2025 | $10,033 | $804,876 | $438,736 | $366,140 |
| 2024 | $10,033 | $789,096 | $430,134 | $358,962 |
| 2023 | $9,877 | $773,626 | $421,700 | $351,926 |
| 2022 | $9,680 | $758,458 | $413,432 | $345,026 |
| 2021 | $9,507 | $743,588 | $405,326 | $338,262 |
| 2020 | $9,560 | $735,966 | $401,170 | $334,796 |
| 2019 | $9,285 | $721,536 | $393,304 | $328,232 |
| 2018 | $8,844 | $707,415 | $385,604 | $321,811 |
| 2017 | $8,440 | $693,546 | $378,044 | $315,502 |
| 2016 | $8,287 | $679,949 | $370,632 | $309,317 |
| 2015 | $8,183 | $669,737 | $365,065 | $304,672 |
| 2014 | $7,967 | $656,619 | $357,914 | $298,705 |
Source: Public Records
Map
Nearby Homes
- 442 Bright St
- 337 Jules Ave
- 914 Capitol Ave
- 275 Miramar Ave
- 224 Shields St
- 424 Garfield St
- 274 Montana St
- 451 Ramsell St
- 271 Granada Ave
- 324 Holloway Ave
- 531 Arch St
- 20 Sargent St
- 233 Sargent St
- 475 Head St
- 34 Brighton Ave
- 621 Shields St
- 54 Eastwood Dr
- 52-54 Eastwood Dr
- 230 Ralston St
- 250 Monticello St