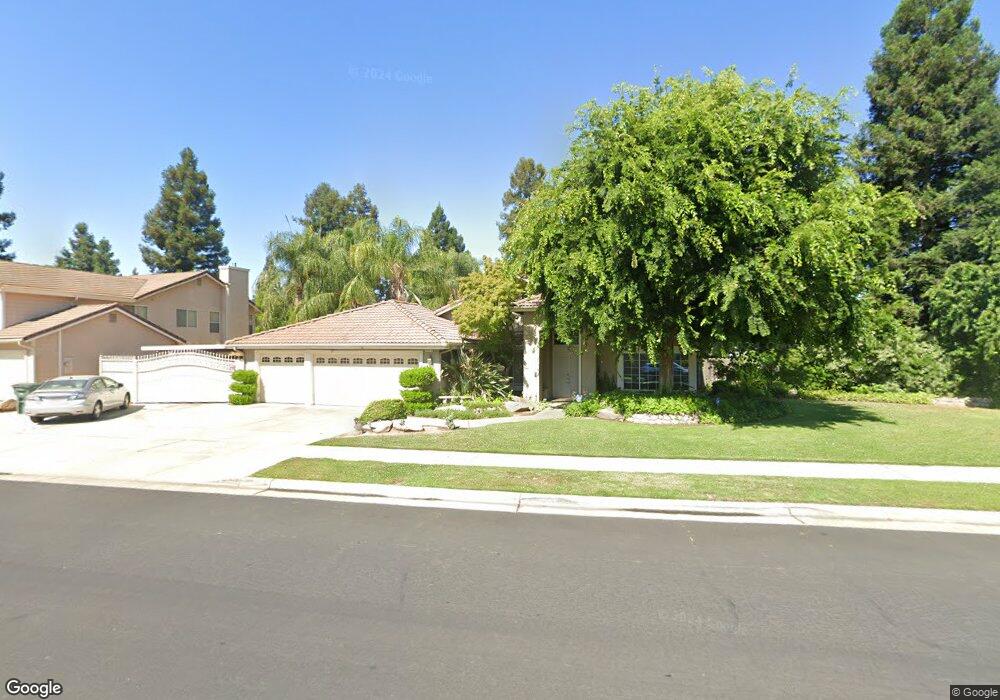
1572 Magnolia Ave Clovis, CA 93611
Estimated Value: $532,482 - $562,000
4
Beds
2
Baths
2,158
Sq Ft
$253/Sq Ft
Est. Value
About This Home
This home is located at 1572 Magnolia Ave, Clovis, CA 93611 and is currently estimated at $546,161, approximately $253 per square foot. 1572 Magnolia Ave is a home located in Fresno County with nearby schools including Clovis Elementary School, Clark Intermediate School, and Clovis High School.
Ownership History
Date
Name
Owned For
Owner Type
Purchase Details
Closed on
Jul 25, 2008
Sold by
Forbes Lamona
Bought by
Forbes Ronald William
Current Estimated Value
Home Financials for this Owner
Home Financials are based on the most recent Mortgage that was taken out on this home.
Original Mortgage
$268,000
Outstanding Balance
$176,585
Interest Rate
6.41%
Mortgage Type
New Conventional
Estimated Equity
$369,576
Purchase Details
Closed on
Apr 19, 2000
Sold by
Schutz Jared M and Schutz Paula E
Bought by
Forbes Ron and Forbes Lamona
Home Financials for this Owner
Home Financials are based on the most recent Mortgage that was taken out on this home.
Original Mortgage
$164,800
Interest Rate
8.08%
Purchase Details
Closed on
Mar 17, 1999
Sold by
Laverne Pattie Scott and Laverne Dawn M
Bought by
Schutz Jared M and Schutz Paula E
Home Financials for this Owner
Home Financials are based on the most recent Mortgage that was taken out on this home.
Original Mortgage
$137,600
Interest Rate
7.1%
Create a Home Valuation Report for This Property
The Home Valuation Report is an in-depth analysis detailing your home's value as well as a comparison with similar homes in the area
Home Values in the Area
Average Home Value in this Area
Purchase History
| Date | Buyer | Sale Price | Title Company |
|---|---|---|---|
| Forbes Ronald William | -- | Placer Title Company | |
| Forbes Ron | $194,000 | First American Title Co | |
| Schutz Jared M | $172,000 | Fidelity National Title Co |
Source: Public Records
Mortgage History
| Date | Status | Borrower | Loan Amount |
|---|---|---|---|
| Open | Forbes Ronald William | $268,000 | |
| Closed | Forbes Ron | $164,800 | |
| Previous Owner | Schutz Jared M | $137,600 |
Source: Public Records
Tax History
| Year | Tax Paid | Tax Assessment Tax Assessment Total Assessment is a certain percentage of the fair market value that is determined by local assessors to be the total taxable value of land and additions on the property. | Land | Improvement |
|---|---|---|---|---|
| 2025 | $3,648 | $301,564 | $69,152 | $232,412 |
| 2023 | $3,498 | $289,856 | $66,468 | $223,388 |
| 2022 | $3,452 | $284,173 | $65,165 | $219,008 |
| 2021 | $3,358 | $278,602 | $63,888 | $214,714 |
| 2020 | $3,345 | $275,746 | $63,233 | $212,513 |
| 2019 | $3,281 | $270,341 | $61,994 | $208,347 |
| 2018 | $3,211 | $265,041 | $60,779 | $204,262 |
| 2017 | $3,145 | $259,845 | $59,588 | $200,257 |
| 2016 | $3,041 | $254,751 | $58,420 | $196,331 |
| 2015 | $2,996 | $250,925 | $57,543 | $193,382 |
| 2014 | $2,941 | $246,010 | $56,416 | $189,594 |
Source: Public Records
Map
Nearby Homes
- 2549 Purvis Ave
- 2518 Keats Ave
- 2668 Scott Ave
- 2020 Hanson Ave
- 865 McKelvy Ave
- 2337 Wrenwood Ave
- 2782 Poe Ave
- 2681 Wrenwood Ave
- 2669 Alamos Ave
- 793 Applegate Ave
- 2034 Wrenwood Ave
- 2222 Carson Ave
- 1895 Dennis Ave
- 1584 Laverne Ave
- 2871 Wrenwood Ave
- 1876 Cougar Ln
- 2691 Morris Ave
- 2963 Finchwood Ave
- 1488 Whittier Ave
- 3045 Keats Ave
- 1582 Magnolia Ave
- 1541 McKelvy Ave
- 1563 McKelvy Ave
- 2522 Dennis Ave
- 1587 McKelvy Ave
- 1598 Magnolia Ave
- 2519 Dennis Ave
- 2527 Beverly Ave
- 2515 Dennis Ave
- 2525 Dennis Ave
- 1595 McKelvy Ave
- 2526 Dennis Ave
- 1606 Magnolia Ave
- 2531 Beverly Ave
- 2533 Dennis Ave
- 1562 McKelvy Ave
- 2511 Dennis Ave
- 1546 McKelvy Ave
- 1580 McKelvy Ave
- 1607 McKelvy Ave
Your Personal Tour Guide
Ask me questions while you tour the home.