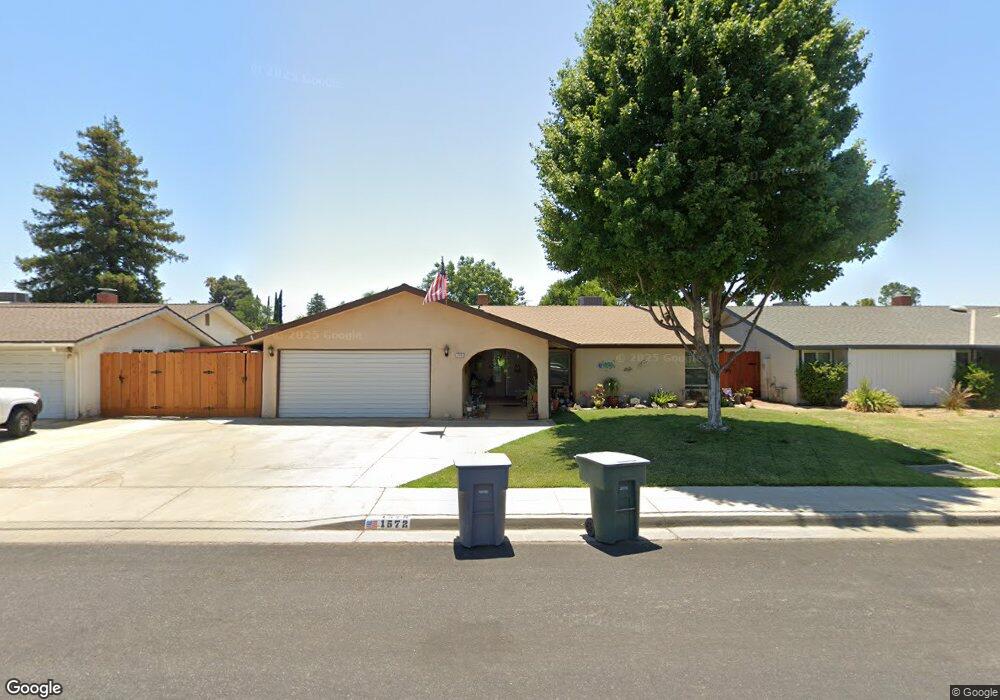
1572 Portals Ave Clovis, CA 93611
Estimated Value: $394,914 - $427,000
3
Beds
2
Baths
1,520
Sq Ft
$267/Sq Ft
Est. Value
About This Home
This home is located at 1572 Portals Ave, Clovis, CA 93611 and is currently estimated at $405,638, approximately $266 per square foot. 1572 Portals Ave is a home located in Fresno County with nearby schools including Clovis Elementary School, Clark Intermediate School, and Clovis High School.
Ownership History
Date
Name
Owned For
Owner Type
Purchase Details
Closed on
Apr 8, 2024
Sold by
Ferguson Mark and Ferguson Stephanie
Bought by
Mark And Stephanie Ferguson Living Trust and Ferguson
Current Estimated Value
Purchase Details
Closed on
Mar 16, 2020
Sold by
Fergueson Mark W and Ferguson Stephanie L
Bought by
Ferguson Mark and Ferguson Stephanie
Home Financials for this Owner
Home Financials are based on the most recent Mortgage that was taken out on this home.
Original Mortgage
$260,864
Interest Rate
3.4%
Mortgage Type
VA
Purchase Details
Closed on
Sep 1, 1998
Sold by
David Diaz
Bought by
Ferguson Mark W and Ferguson Stephanie L
Home Financials for this Owner
Home Financials are based on the most recent Mortgage that was taken out on this home.
Original Mortgage
$107,635
Interest Rate
6.61%
Mortgage Type
VA
Create a Home Valuation Report for This Property
The Home Valuation Report is an in-depth analysis detailing your home's value as well as a comparison with similar homes in the area
Home Values in the Area
Average Home Value in this Area
Purchase History
| Date | Buyer | Sale Price | Title Company |
|---|---|---|---|
| Mark And Stephanie Ferguson Living Trust | -- | None Listed On Document | |
| Ferguson Mark | -- | Placer Title Company | |
| Ferguson Mark W | $104,500 | First American Title Ins Co |
Source: Public Records
Mortgage History
| Date | Status | Borrower | Loan Amount |
|---|---|---|---|
| Previous Owner | Ferguson Mark | $260,864 | |
| Previous Owner | Ferguson Mark W | $107,635 |
Source: Public Records
Tax History
| Year | Tax Paid | Tax Assessment Tax Assessment Total Assessment is a certain percentage of the fair market value that is determined by local assessors to be the total taxable value of land and additions on the property. | Land | Improvement |
|---|---|---|---|---|
| 2025 | $1,863 | $163,799 | $47,019 | $116,780 |
| 2023 | $1,790 | $157,442 | $45,195 | $112,247 |
| 2022 | $1,765 | $154,356 | $44,309 | $110,047 |
| 2021 | $1,714 | $151,331 | $43,441 | $107,890 |
| 2020 | $1,707 | $149,780 | $42,996 | $106,784 |
| 2019 | $1,672 | $146,844 | $42,153 | $104,691 |
| 2018 | $1,634 | $143,966 | $41,327 | $102,639 |
| 2017 | $1,605 | $141,144 | $40,517 | $100,627 |
| 2016 | $1,550 | $138,377 | $39,723 | $98,654 |
| 2015 | $1,525 | $136,300 | $39,127 | $97,173 |
| 2014 | $1,495 | $133,631 | $38,361 | $95,270 |
Source: Public Records
Map
Nearby Homes
- 1606 Barstow Ave
- 911 Stanford Ave
- 1622 Dennis Ave
- 1273 Bundy Ave
- 1428 Miami Ave
- 1334 Shirley Ave
- 1721 Beverly Ave
- 1228 Jefferson Ave
- 1488 Whittier Ave
- 1515 Keats Ave
- 760 Sunnyside Ave
- 860 Mcarthur Ave
- 1876 Cougar Ln
- 1895 Dennis Ave
- 1584 Laverne Ave
- 1272 Bullard Ave
- 3497 Shaw Ave
- 1946 Calimyrna Ave
- 2214 Fordham Ave
- 2034 Wrenwood Ave
- 1562 Portals Ave
- 1571 Barstow Ave
- 1581 Barstow Ave
- 1559 Barstow Ave
- 1594 Portals Ave
- 1550 Portals Ave
- 1571 Portals Ave
- 1595 Barstow Ave
- 1561 Portals Ave
- 1581 Portals Ave
- 1547 Barstow Ave
- 1540 Portals Ave
- 1549 Portals Ave
- 1595 Portals Ave
- 1535 Barstow Ave
- 1539 Portals Ave
- 1572 Lincoln Ave
- 1562 Lincoln Ave
- 1582 Lincoln Ave
- 1528 Portals Ave
Your Personal Tour Guide
Ask me questions while you tour the home.