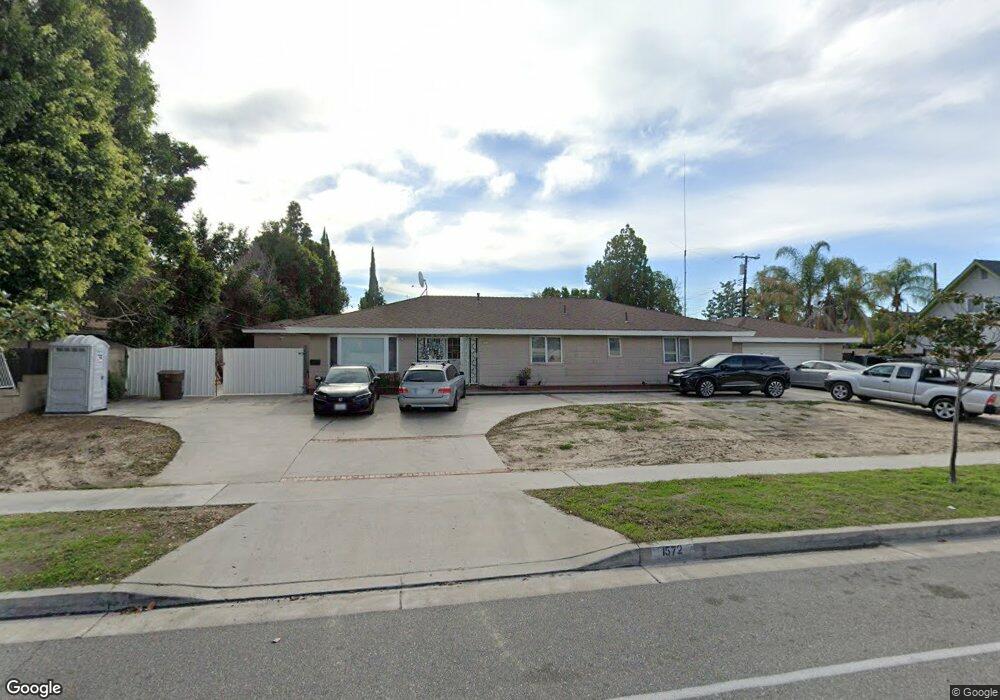
1572 W Orangewood Ave Anaheim, CA 92802
Hermosa Village NeighborhoodEstimated Value: $1,222,000 - $1,338,000
3
Beds
2
Baths
2,016
Sq Ft
$634/Sq Ft
Est. Value
About This Home
This home is located at 1572 W Orangewood Ave, Anaheim, CA 92802 and is currently estimated at $1,277,627, approximately $633 per square foot. 1572 W Orangewood Ave is a home located in Orange County with nearby schools including Alexander J. Stoddard Elementary School, Ball Junior High School, and Loara High School.
Ownership History
Date
Name
Owned For
Owner Type
Purchase Details
Closed on
Feb 10, 2024
Sold by
Pham Joseph
Bought by
Dao Khanh and Pham Tiffany
Current Estimated Value
Purchase Details
Closed on
Mar 18, 2013
Sold by
Orangewood Trust #1572
Bought by
Pham Joseph
Purchase Details
Closed on
Jul 2, 2012
Sold by
Cao Cong Hien
Bought by
Orangewood Trust #1572 and Southland Homes Real Estate & Investment
Purchase Details
Closed on
Feb 1, 2012
Sold by
Cao Cong Hien
Bought by
Lam Maitrinh Thi
Purchase Details
Closed on
Jun 27, 2003
Sold by
Orangewood Ave Trust #1572
Bought by
Cao Cong Hien
Home Financials for this Owner
Home Financials are based on the most recent Mortgage that was taken out on this home.
Original Mortgage
$320,000
Interest Rate
5.6%
Mortgage Type
Purchase Money Mortgage
Purchase Details
Closed on
Oct 28, 1993
Sold by
Holmes Ronald
Bought by
Holmes Ronald G
Create a Home Valuation Report for This Property
The Home Valuation Report is an in-depth analysis detailing your home's value as well as a comparison with similar homes in the area
Home Values in the Area
Average Home Value in this Area
Purchase History
| Date | Buyer | Sale Price | Title Company |
|---|---|---|---|
| Dao Khanh | -- | None Listed On Document | |
| Pham Joseph | $420,000 | First American Title Company | |
| Orangewood Trust #1572 | -- | None Available | |
| Lam Maitrinh Thi | -- | None Available | |
| Cao Cong Hien | $455,000 | First American Title Co | |
| Holmes Ronald G | -- | -- |
Source: Public Records
Mortgage History
| Date | Status | Borrower | Loan Amount |
|---|---|---|---|
| Previous Owner | Cao Cong Hien | $320,000 |
Source: Public Records
Tax History Compared to Growth
Tax History
| Year | Tax Paid | Tax Assessment Tax Assessment Total Assessment is a certain percentage of the fair market value that is determined by local assessors to be the total taxable value of land and additions on the property. | Land | Improvement |
|---|---|---|---|---|
| 2025 | $7,576 | $1,224,000 | $816,000 | $408,000 |
| 2024 | $7,576 | $640,286 | $351,407 | $288,879 |
| 2023 | $5,839 | $497,110 | $344,516 | $152,594 |
| 2022 | $5,766 | $487,363 | $337,761 | $149,602 |
| 2021 | $5,777 | $477,807 | $331,138 | $146,669 |
| 2020 | $5,754 | $472,908 | $327,742 | $145,166 |
| 2019 | $5,581 | $463,636 | $321,316 | $142,320 |
| 2018 | $5,466 | $454,546 | $315,016 | $139,530 |
| 2017 | $5,250 | $445,634 | $308,839 | $136,795 |
| 2016 | $5,235 | $436,897 | $302,784 | $134,113 |
| 2015 | $5,190 | $430,335 | $298,236 | $132,099 |
| 2014 | -- | $421,906 | $292,394 | $129,512 |
Source: Public Records
Map
Nearby Homes
- 2227 S Atlanta St
- 11552 9th St
- 1913 S Norma Ln
- 11341 Jacalene Ln
- 1828 S Ninth St
- 11301 Euclid St Unit 60
- 11301 Euclid St Unit 21
- 11252 Chapman Ave
- 11531 Kathy Ln
- 11401 Kathy Ln
- 11441 Dolan St
- 11402 Morgan Ln
- 10691 Perrin Dr
- 11531 West St
- 10882 Chapman Ave
- 11731 Rose Dr
- 405 13181 Lampson
- 11102 Avolencia Place
- 12071 Diane St
- 11401 Tobie St
- 1576 W Orangewood Ave
- 1580 W Orangewood Ave
- 1564 W Orangewood Ave
- 1583 W Sim Place
- 1586 W Orangewood Ave
- 2125 S Atlanta St
- 1566 W Flippen Cir
- 2105 S Hammatt Pkwy
- 1587 W Sim Place
- 2135 S Hammatt Pkwy
- 1564 W Flippen Cir
- 2165 S Hammatt Pkwy
- 2082 S Eileen Dr
- 2124 S Atlanta St
- 1558 W Flippen Cir
- 1592 W Orangewood Ave
- 2129 S Atlanta St
- 1582 W Sim Place
- 1593 W Sim Place
- 2076 S Eileen Dr