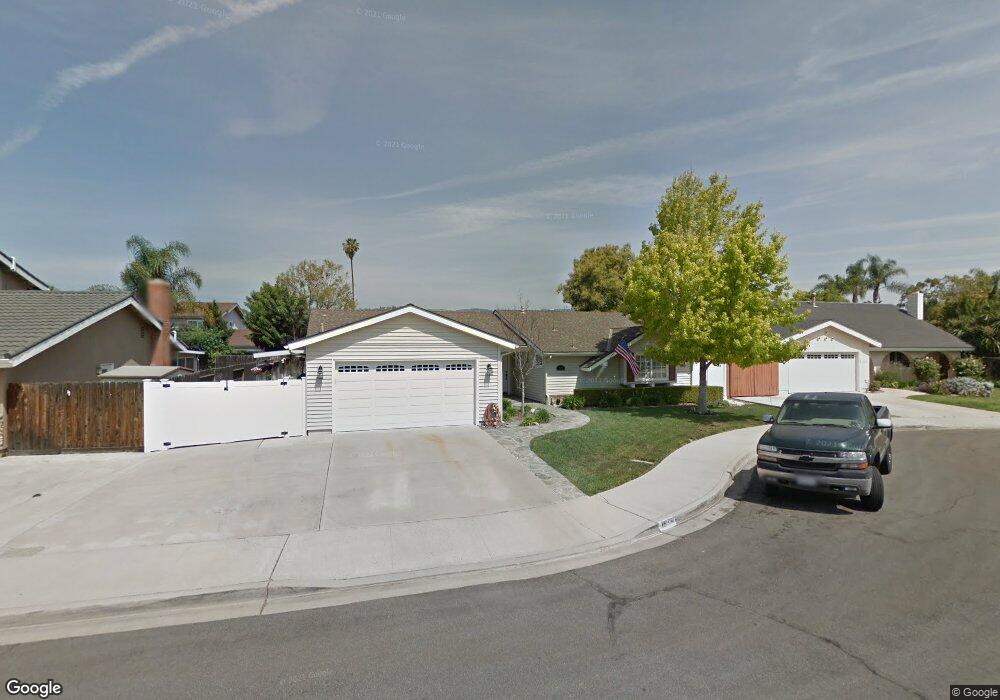
1573 Sequan Ct Camarillo, CA 93010
Estimated Value: $857,000 - $959,000
4
Beds
2
Baths
1,748
Sq Ft
$517/Sq Ft
Est. Value
About This Home
This home is located at 1573 Sequan Ct, Camarillo, CA 93010 and is currently estimated at $903,881, approximately $517 per square foot. 1573 Sequan Ct is a home located in Ventura County with nearby schools including Dos Caminos Elementary School, Monte Vista Middle School, and Adolfo Camarillo High School.
Ownership History
Date
Name
Owned For
Owner Type
Purchase Details
Closed on
Oct 12, 2020
Sold by
Walton Patrick and Walton Mary
Bought by
Walton Patrick B and Walton Mary J
Current Estimated Value
Home Financials for this Owner
Home Financials are based on the most recent Mortgage that was taken out on this home.
Original Mortgage
$365,500
Outstanding Balance
$262,698
Interest Rate
2.9%
Mortgage Type
New Conventional
Estimated Equity
$641,183
Purchase Details
Closed on
Sep 18, 2007
Sold by
Walton Patrick B and Walton Mary J
Bought by
Walton Patrick B and Walton Mary J
Purchase Details
Closed on
Jun 2, 1997
Sold by
James Patterson
Bought by
Walton Patrick B and Walton Mary J
Home Financials for this Owner
Home Financials are based on the most recent Mortgage that was taken out on this home.
Original Mortgage
$204,250
Interest Rate
7.93%
Create a Home Valuation Report for This Property
The Home Valuation Report is an in-depth analysis detailing your home's value as well as a comparison with similar homes in the area
Home Values in the Area
Average Home Value in this Area
Purchase History
| Date | Buyer | Sale Price | Title Company |
|---|---|---|---|
| Walton Patrick B | -- | Wfg Title Company Of Ca | |
| Walton Patrick | -- | Wfg National Title Co Of Ca | |
| Walton Patrick B | -- | None Available | |
| Walton Patrick B | $215,000 | Fidelity National Title Co |
Source: Public Records
Mortgage History
| Date | Status | Borrower | Loan Amount |
|---|---|---|---|
| Open | Walton Patrick | $365,500 | |
| Closed | Walton Patrick B | $204,250 |
Source: Public Records
Tax History
| Year | Tax Paid | Tax Assessment Tax Assessment Total Assessment is a certain percentage of the fair market value that is determined by local assessors to be the total taxable value of land and additions on the property. | Land | Improvement |
|---|---|---|---|---|
| 2025 | $3,742 | $343,264 | $137,302 | $205,962 |
| 2024 | $3,742 | $336,534 | $134,610 | $201,924 |
| 2023 | $3,608 | $329,936 | $131,971 | $197,965 |
| 2022 | $3,595 | $323,467 | $129,383 | $194,084 |
| 2021 | $3,466 | $317,125 | $126,846 | $190,279 |
| 2020 | $3,452 | $313,876 | $125,547 | $188,329 |
| 2019 | $3,435 | $307,723 | $123,086 | $184,637 |
| 2018 | $3,370 | $301,690 | $120,673 | $181,017 |
| 2017 | $3,172 | $295,775 | $118,307 | $177,468 |
| 2016 | $3,096 | $289,977 | $115,988 | $173,989 |
| 2015 | $3,062 | $285,624 | $114,247 | $171,377 |
| 2014 | $2,991 | $280,031 | $112,010 | $168,021 |
Source: Public Records
Map
Nearby Homes
- 1623 Regent St
- 1682 Darnell Ct
- 1387 Lantana St
- 1944 Hayden St
- 1610 Edgewater Ln
- 1487 Nordman Dr
- 2174 Wilcox St
- 1075 Seybolt Ave
- 1709 Las Posas Rd
- 425 Baja Ct
- 157 Lantana St
- 939 Calabria Ct
- 2854 Via Monte Mar
- 2103 Euclid Ave
- 647 Arneill Rd
- 1016 Camino Vera Cruz
- 1143 Bordeaux Ave
- 1067 Bordeaux Ave
- 1440 Lexington Ct
- 560 Rosewood Ave
- 1565 Sequan Ct
- 1587 Sequan Ct
- 1574 Cipres Ct
- 1588 Cipres Ct
- 1566 Cipres Ct
- 1559 Sequan Ct
- 1595 Sequan Ct
- 1572 Sequan Ct
- 1558 Cipres Ct
- 1560 Sequan Ct
- 1596 Cipres Ct
- 1590 Sequan Ct
- 1598 Sequan Ct
- 1553 Sequan Ct
- 1554 Cipres Ct
- 1109 Modesto Ave
- 1056 Agusta Ave
- 1121 Modesto Ave
- 1087 Modesto Ave
- 1571 Cipres Ct
Your Personal Tour Guide
Ask me questions while you tour the home.