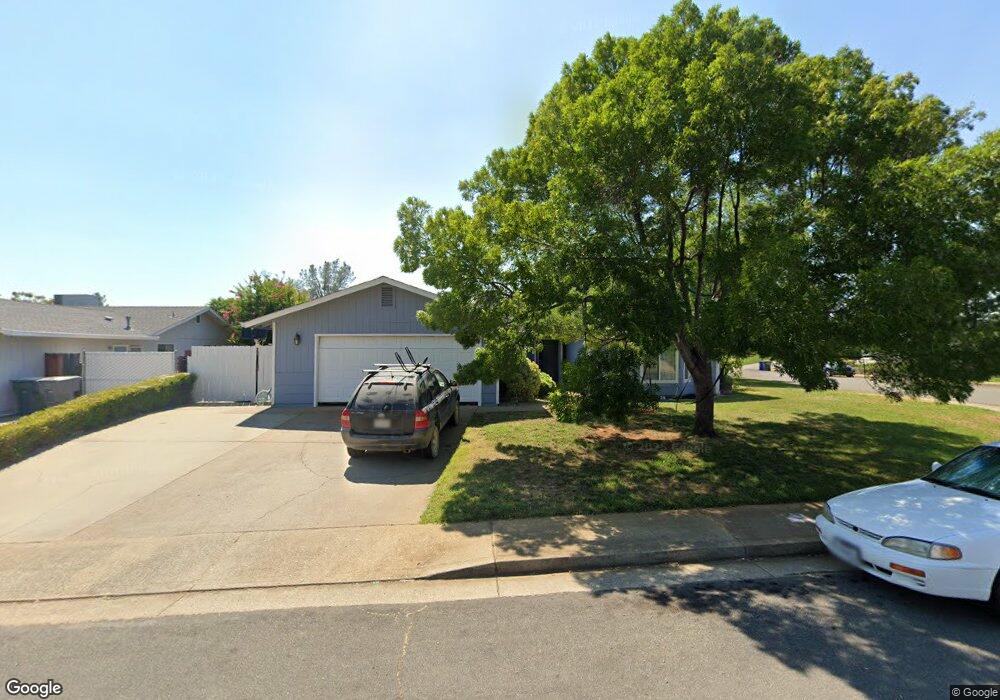
158 Justin Way Unit 1 Redding, CA 96003
Simpson University Region NeighborhoodEstimated Value: $402,227 - $464,000
4
Beds
2
Baths
1,754
Sq Ft
$243/Sq Ft
Est. Value
About This Home
This home is located at 158 Justin Way Unit 1, Redding, CA 96003 and is currently estimated at $426,557, approximately $243 per square foot. 158 Justin Way Unit 1 is a home located in Shasta County with nearby schools including Columbia Elementary School, Mountain View Middle School, and Foothill High School.
Ownership History
Date
Name
Owned For
Owner Type
Purchase Details
Closed on
Jun 25, 2020
Sold by
Lindholm Beverly J
Bought by
Vorbau Aaron Arthur and Vorbau Rachael Lynn
Current Estimated Value
Home Financials for this Owner
Home Financials are based on the most recent Mortgage that was taken out on this home.
Original Mortgage
$99,500
Outstanding Balance
$88,394
Interest Rate
3.2%
Mortgage Type
Seller Take Back
Estimated Equity
$338,163
Purchase Details
Closed on
Jan 2, 2015
Sold by
Schlange Josh and Schlange Molly
Bought by
Lindholm Beverly J
Purchase Details
Closed on
Jul 15, 2003
Sold by
Schlange Josh
Bought by
Schlange Josh and Schlange Molly
Home Financials for this Owner
Home Financials are based on the most recent Mortgage that was taken out on this home.
Original Mortgage
$97,000
Interest Rate
4.59%
Mortgage Type
Purchase Money Mortgage
Purchase Details
Closed on
Mar 15, 1999
Sold by
Selby Donald E Trustee
Bought by
Schlange Josh
Home Financials for this Owner
Home Financials are based on the most recent Mortgage that was taken out on this home.
Original Mortgage
$90,000
Interest Rate
6.73%
Create a Home Valuation Report for This Property
The Home Valuation Report is an in-depth analysis detailing your home's value as well as a comparison with similar homes in the area
Home Values in the Area
Average Home Value in this Area
Purchase History
| Date | Buyer | Sale Price | Title Company |
|---|---|---|---|
| Vorbau Aaron Arthur | $299,500 | Placer Title Company | |
| Lindholm Beverly J | $229,500 | Placer Title Company | |
| Schlange Josh | -- | Chicago Title Co | |
| Schlange Josh | $105,000 | Fidelity National Title Co |
Source: Public Records
Mortgage History
| Date | Status | Borrower | Loan Amount |
|---|---|---|---|
| Open | Vorbau Aaron Arthur | $99,500 | |
| Previous Owner | Schlange Josh | $97,000 | |
| Previous Owner | Schlange Josh | $90,000 |
Source: Public Records
Tax History Compared to Growth
Tax History
| Year | Tax Paid | Tax Assessment Tax Assessment Total Assessment is a certain percentage of the fair market value that is determined by local assessors to be the total taxable value of land and additions on the property. | Land | Improvement |
|---|---|---|---|---|
| 2025 | $3,529 | $327,542 | $65,616 | $261,926 |
| 2024 | $3,539 | $321,121 | $64,330 | $256,791 |
| 2023 | $3,539 | $314,825 | $63,069 | $251,756 |
| 2022 | $3,411 | $308,653 | $61,833 | $246,820 |
| 2021 | $3,413 | $302,602 | $60,621 | $241,981 |
| 2020 | $2,922 | $252,201 | $49,449 | $202,752 |
| 2019 | $2,856 | $247,257 | $48,480 | $198,777 |
| 2018 | $2,872 | $242,410 | $47,530 | $194,880 |
| 2017 | $2,905 | $237,658 | $46,599 | $191,059 |
| 2016 | $2,723 | $232,999 | $45,686 | $187,313 |
| 2015 | $1,720 | $144,909 | $32,603 | $112,306 |
| 2014 | $1,599 | $142,072 | $31,965 | $110,107 |
Source: Public Records
Map
Nearby Homes
- 40 Ortega Ct
- 60 Rose Ln
- 1381 Chaos Walk
- 2147 Edinburgh Way
- 19219 Nike Ct
- 2154 Harvard Way
- 2110 Cilantro Dr
- 693 Yolla Bolly Trail
- 624 Volcano View Trail
- 866 Fountain Cir
- 790 Volcano View Trail
- 550 Armando Ave
- 1102 Hope Ln
- 667 Reddington Dr
- 948 & 950 Hawley
- 11632 Ridgewood Rd
- 774 Springer Dr
- 5663 Terra Linda Way
- 654 Rogue River Way
- 592 Mill Valley Pkwy
- 158 Justin Way
- 172 Justin Way
- 132 Justin Way
- 188 Justin Way Unit 1
- 188 Justin Way
- 141 Justin Way
- 137 Justin Way
- 124 Justin Way Unit 1
- 124 Justin Way
- 167 Justin Way
- 161 Justin Way
- 145 Justin Way
- 129 Justin Way Unit 1
- 129 Justin Way
- 175 Justin Way
- 1660 Strauss Ln
- 153 Justin Way
- 196 Justin Way
- 122 Justin Way
- 183 Justin Way