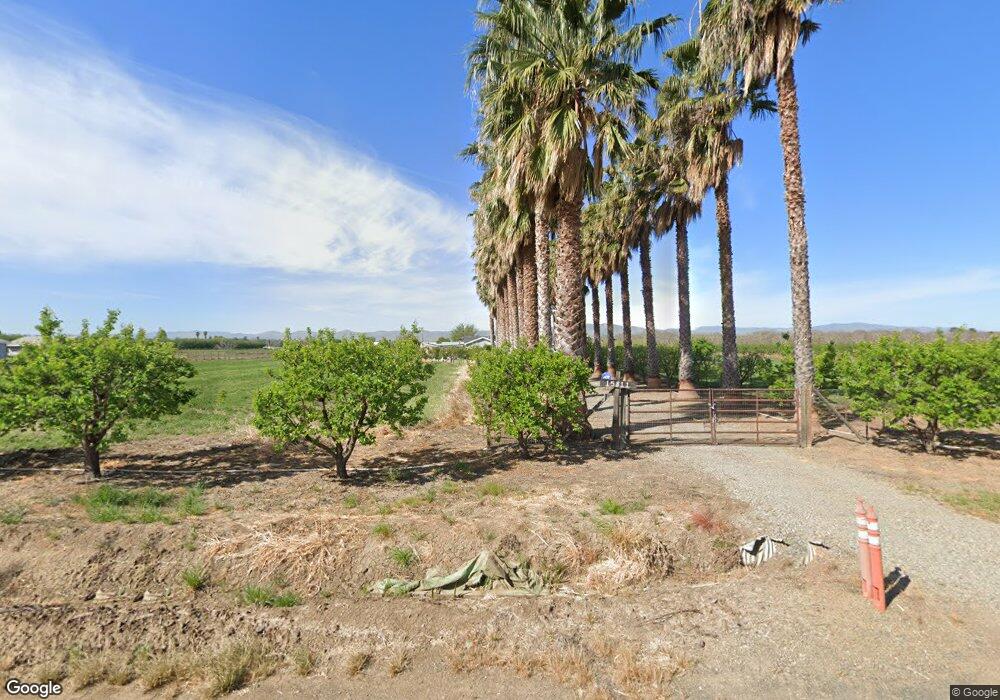
15811 Sycamore Ave Patterson, CA 95363
Estimated Value: $497,000 - $895,057
3
Beds
2
Baths
1,694
Sq Ft
$425/Sq Ft
Est. Value
About This Home
This home is located at 15811 Sycamore Ave, Patterson, CA 95363 and is currently estimated at $719,764, approximately $424 per square foot. 15811 Sycamore Ave is a home located in Stanislaus County with nearby schools including Las Palmas Elementary School, Creekside Middle School, and Patterson High School.
Ownership History
Date
Name
Owned For
Owner Type
Purchase Details
Closed on
Apr 19, 2004
Sold by
Gomez Mitchell D
Bought by
Hernandez Gumercindo and Hernandez Maricela
Current Estimated Value
Purchase Details
Closed on
Jul 25, 2001
Sold by
Offner Kenneth
Bought by
Offner Kenneth
Purchase Details
Closed on
Jul 17, 2000
Sold by
Arambel & Rose Investment Co
Bought by
Offner Kenneth
Home Financials for this Owner
Home Financials are based on the most recent Mortgage that was taken out on this home.
Original Mortgage
$205,950
Interest Rate
8.11%
Mortgage Type
Construction
Purchase Details
Closed on
Jul 11, 2000
Sold by
Arambel & Rose Investment Co
Bought by
Gomez Mitchell D
Home Financials for this Owner
Home Financials are based on the most recent Mortgage that was taken out on this home.
Original Mortgage
$205,950
Interest Rate
8.11%
Mortgage Type
Construction
Create a Home Valuation Report for This Property
The Home Valuation Report is an in-depth analysis detailing your home's value as well as a comparison with similar homes in the area
Purchase History
| Date | Buyer | Sale Price | Title Company |
|---|---|---|---|
| Hernandez Gumercindo | $400,000 | Stewart Title Of Modesto | |
| Offner Kenneth | -- | Chicago Title Co | |
| Offner Kenneth | $115,000 | Chicago Title Co | |
| Gomez Mitchell D | $115,000 | Chicago Title Co |
Source: Public Records
Mortgage History
| Date | Status | Borrower | Loan Amount |
|---|---|---|---|
| Previous Owner | Offner Kenneth | $205,950 | |
| Previous Owner | Gomez Mitchell D | $62,500 |
Source: Public Records
Tax History
| Year | Tax Paid | Tax Assessment Tax Assessment Total Assessment is a certain percentage of the fair market value that is determined by local assessors to be the total taxable value of land and additions on the property. | Land | Improvement |
|---|---|---|---|---|
| 2025 | $6,697 | $568,703 | $443,592 | $125,111 |
| 2024 | $6,674 | $557,553 | $434,895 | $122,658 |
| 2023 | $6,522 | $546,621 | $426,368 | $120,253 |
| 2022 | $6,146 | $535,904 | $418,008 | $117,896 |
| 2021 | $6,085 | $525,397 | $409,812 | $115,585 |
| 2020 | $6,051 | $520,010 | $405,610 | $114,400 |
| 2019 | $5,957 | $509,814 | $397,657 | $112,157 |
| 2018 | $5,668 | $499,818 | $389,860 | $109,958 |
| 2017 | $5,548 | $490,018 | $382,216 | $107,802 |
| 2016 | $5,397 | $480,411 | $374,722 | $105,689 |
| 2015 | $5,321 | $473,196 | $369,094 | $104,102 |
| 2014 | $3,383 | $298,120 | $223,000 | $75,120 |
Source: Public Records
Map
Nearby Homes
- 16012 Sycamore Ave
- 1290 Orange Ave
- 600 Sears Dr
- 814 Bogdanich Pkwy
- 538 Chesterfield Dr
- 518 Bedfordshire Dr
- 517 Nordell Place
- 250 E Las Palmas Ave Unit 13
- 918 Cumbria Ln
- 617 Mansfield Dr
- 1430 Walnut Ave
- 0 Orange Ave
- 737 Featherstone Dr
- 804 Wissett Place
- 805 Wissett Place
- 809 Wissett Place
- 820 Summerhouse Dr
- 800 Chatham Ln
- 801 Chatham Ln
- 804 Chatham Ln
- 15825 Sycamore Ave
- 15931 Sycamore Ave
- 15734 Sycamore Ave
- 15642 Sycamore Ave
- 15961 Sycamore Ave
- 843 Orange Ave
- 15556 Sycamore Ave
- 900 Orange Ave
- 900 E Las Palmas Ave
- 1066 Orange Ave
- 0 Sycamore Ave Unit 16063785
- 0 Sycamore Ave Unit 17052048
- 0 Sycamore Ave Unit 18010130
- 0 Sycamore Ave Unit ML81674689
- 0 Sycamore Ave Unit 41047842
- 0 Sycamore Ave Unit 222142875
- 0 Sycamore Ave Unit 221122117
- 0 Sycamore Ave Unit 132007358
- 17947 Sycamore Ave
- 999999 Sycamore Ave
Your Personal Tour Guide
Ask me questions while you tour the home.