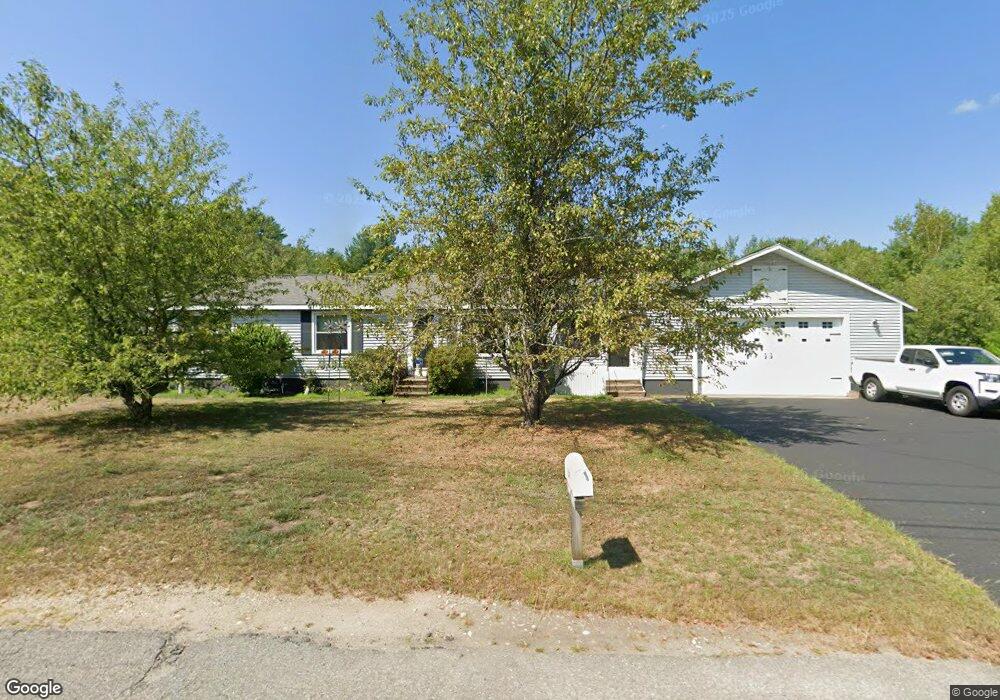
159 Memorial Dr Orange, MA 01364
Estimated Value: $338,000 - $449,000
3
Beds
3
Baths
1,352
Sq Ft
$276/Sq Ft
Est. Value
About This Home
This home is located at 159 Memorial Dr, Orange, MA 01364 and is currently estimated at $373,603, approximately $276 per square foot. 159 Memorial Dr is a home located in Franklin County with nearby schools including Fisher Hill and Ralph C Mahar Regional School.
Ownership History
Date
Name
Owned For
Owner Type
Purchase Details
Closed on
Jun 27, 2014
Sold by
Arsenault Allen P
Bought by
Arsenault Allen P and Arsenault Therese I
Current Estimated Value
Purchase Details
Closed on
Mar 14, 1997
Sold by
Contimortgage Corp
Bought by
Arsenault Allen P
Purchase Details
Closed on
Oct 25, 1996
Sold by
Higgins Tonya C
Bought by
Contimortgage Corp
Purchase Details
Closed on
Apr 27, 1992
Sold by
Ginsberg Roye S and Ginsberg Diane C
Bought by
Higgins Steven F and Higgins Tonya C
Create a Home Valuation Report for This Property
The Home Valuation Report is an in-depth analysis detailing your home's value as well as a comparison with similar homes in the area
Home Values in the Area
Average Home Value in this Area
Purchase History
| Date | Buyer | Sale Price | Title Company |
|---|---|---|---|
| Arsenault Allen P | -- | -- | |
| Arsenault Allen P | $77,500 | -- | |
| Contimortgage Corp | $84,000 | -- | |
| Higgins Steven F | $89,900 | -- |
Source: Public Records
Mortgage History
| Date | Status | Borrower | Loan Amount |
|---|---|---|---|
| Previous Owner | Higgins Steven F | $50,000 | |
| Previous Owner | Higgins Steven F | $15,000 |
Source: Public Records
Tax History
| Year | Tax Paid | Tax Assessment Tax Assessment Total Assessment is a certain percentage of the fair market value that is determined by local assessors to be the total taxable value of land and additions on the property. | Land | Improvement |
|---|---|---|---|---|
| 2025 | $55 | $334,100 | $32,000 | $302,100 |
| 2024 | $5,037 | $288,800 | $32,000 | $256,800 |
| 2023 | $4,939 | $275,000 | $32,000 | $243,000 |
| 2022 | $4,587 | $239,900 | $32,000 | $207,900 |
| 2021 | $4,223 | $210,600 | $53,900 | $156,700 |
| 2020 | $4,153 | $204,300 | $53,600 | $150,700 |
| 2019 | $3,835 | $170,300 | $48,000 | $122,300 |
| 2018 | $3,655 | $166,600 | $47,300 | $119,300 |
| 2017 | $3,537 | $166,600 | $47,300 | $119,300 |
| 2016 | $3,567 | $164,400 | $47,300 | $117,100 |
| 2015 | $3,452 | $166,200 | $47,300 | $118,900 |
| 2014 | $3,358 | $170,100 | $47,300 | $122,800 |
Source: Public Records
Map
Nearby Homes
Your Personal Tour Guide
Ask me questions while you tour the home.