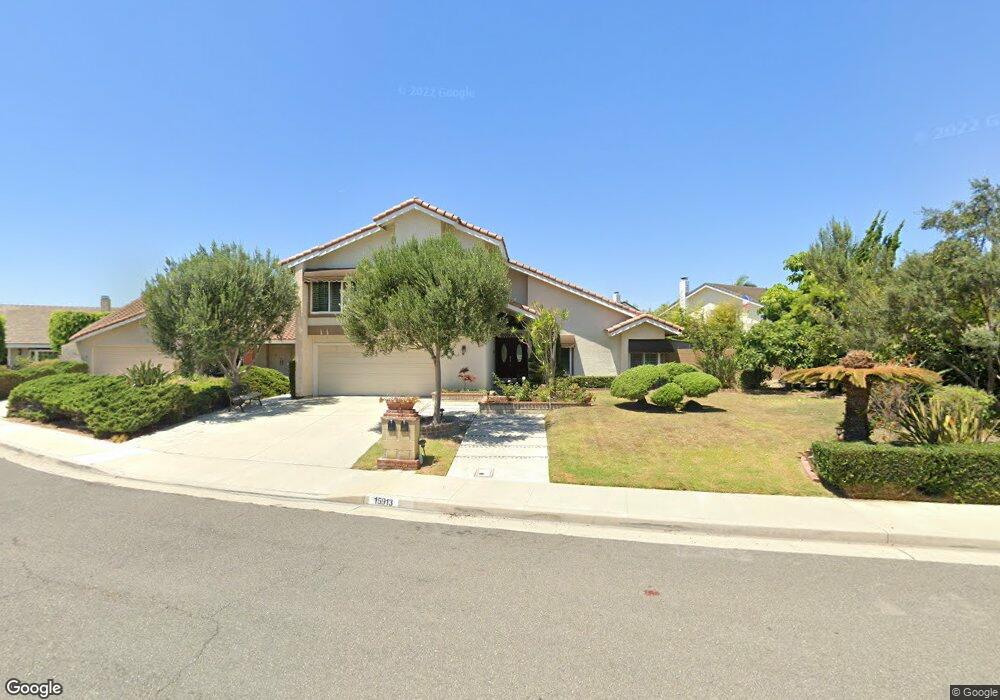
15913 Clarendon St Fountain Valley, CA 92708
Estimated Value: $1,535,100 - $1,776,000
4
Beds
3
Baths
2,332
Sq Ft
$727/Sq Ft
Est. Value
About This Home
This home is located at 15913 Clarendon St, Fountain Valley, CA 92708 and is currently estimated at $1,695,275, approximately $726 per square foot. 15913 Clarendon St is a home located in Orange County with nearby schools including Ethan B. Allen Elementary School, McGarvin Intermediate School, and La Quinta High School.
Ownership History
Date
Name
Owned For
Owner Type
Purchase Details
Closed on
Sep 5, 2024
Sold by
Nguyen Van Thu and Burnett Kim Nguyen
Bought by
Burnett Kim Nguyen and Burnett Edwin Moore
Current Estimated Value
Purchase Details
Closed on
Dec 16, 1993
Sold by
Burnett Edwin Moore
Bought by
Burnett Kim Nguyen
Home Financials for this Owner
Home Financials are based on the most recent Mortgage that was taken out on this home.
Original Mortgage
$130,000
Interest Rate
7.2%
Purchase Details
Closed on
Oct 19, 1993
Sold by
Nguyen Ly and Lam Thu Nhi
Bought by
Nguyen Van Thu and Burnett Kim Nguyen
Home Financials for this Owner
Home Financials are based on the most recent Mortgage that was taken out on this home.
Original Mortgage
$130,000
Interest Rate
7.2%
Create a Home Valuation Report for This Property
The Home Valuation Report is an in-depth analysis detailing your home's value as well as a comparison with similar homes in the area
Home Values in the Area
Average Home Value in this Area
Purchase History
| Date | Buyer | Sale Price | Title Company |
|---|---|---|---|
| Burnett Kim Nguyen | -- | Orange Coast Title | |
| Burnett Kim Nguyen | -- | Investors Title Company | |
| Nguyen Van Thu | -- | Investors Title Company |
Source: Public Records
Mortgage History
| Date | Status | Borrower | Loan Amount |
|---|---|---|---|
| Previous Owner | Nguyen Van Thu | $130,000 |
Source: Public Records
Tax History Compared to Growth
Tax History
| Year | Tax Paid | Tax Assessment Tax Assessment Total Assessment is a certain percentage of the fair market value that is determined by local assessors to be the total taxable value of land and additions on the property. | Land | Improvement |
|---|---|---|---|---|
| 2025 | $5,505 | $1,056,352 | $850,144 | $206,208 |
| 2024 | $5,505 | $473,236 | $265,520 | $207,716 |
| 2023 | $5,401 | $463,957 | $260,313 | $203,644 |
| 2022 | $5,284 | $454,860 | $255,209 | $199,651 |
| 2021 | $5,230 | $445,942 | $250,205 | $195,737 |
| 2020 | $5,158 | $441,370 | $247,640 | $193,730 |
| 2019 | $5,057 | $432,716 | $242,784 | $189,932 |
| 2018 | $4,954 | $424,232 | $238,024 | $186,208 |
| 2017 | $4,887 | $415,914 | $233,357 | $182,557 |
| 2016 | $4,672 | $407,759 | $228,781 | $178,978 |
| 2015 | $4,606 | $401,635 | $225,345 | $176,290 |
| 2014 | $4,491 | $393,768 | $220,931 | $172,837 |
Source: Public Records
Map
Nearby Homes
- 15781 Clarendon St
- 9801 Hibiscus Ave
- 9831 Cloverdale Ave
- 15710 Poinsettia Way
- 15690 Poinsettia Way
- 16379 Shadbush St
- 9485 Geranium Cir
- 9190 Poppy Cir
- 9446 Gardenia Ave
- 8961 Emerald Ave
- 16767 Madrone Cir
- 15300 Magnolia St Unit 71
- 16806 Olive St
- 8822 Palos Verdes Ave
- 10200 Bolsa Ave Unit 23
- 10744 Lehnhardt Ave
- 10091 Bolsa Ave
- 9851 Bolsa Ave Unit 198
- 9936 Pear Dr
- 15110 Henley Dr Unit 51
- 9740 Weare Ave
- 15925 Clarendon St
- 9756 Weare Ave
- 9728 Weare Ave
- 15935 Clarendon St
- 9714 Weare Ave
- 15912 Clarendon St
- 15945 Clarendon St
- 15902 Clarendon St
- 15960 Clarendon St
- 15906 Overton St
- 15884 Clarendon St
- 15892 Overton St
- 9741 Weare Ave
- 15920 Overton St
- 15955 Clarendon St
- 9755 Weare Ave
- 9729 Weare Ave
- 15880 Overton St
- 15934 Overton St