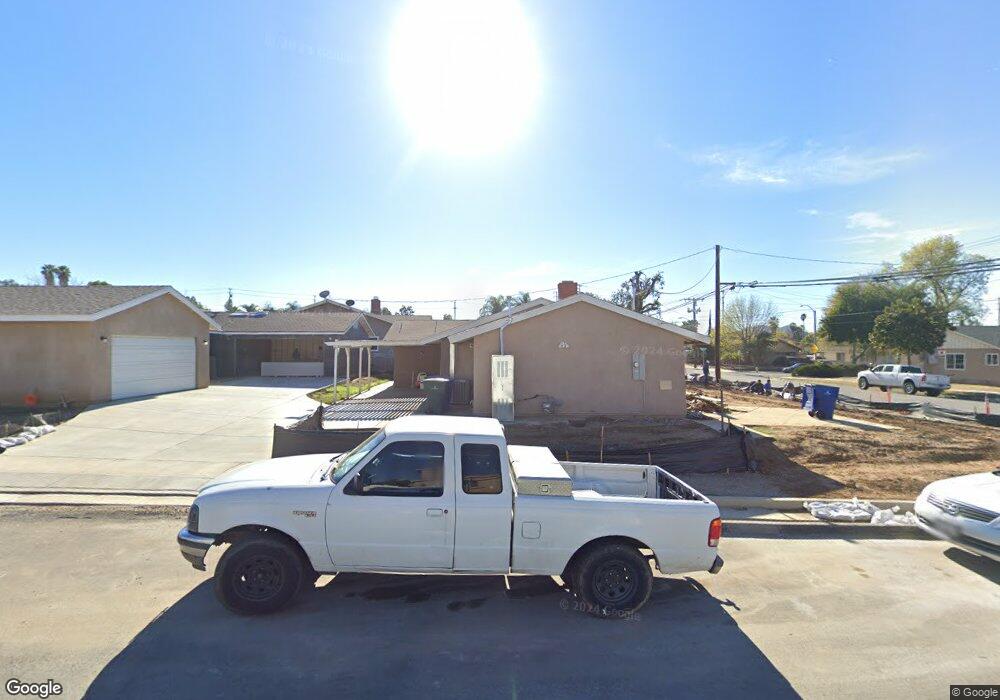
1594 N Orange St Riverside, CA 92501
Northside NeighborhoodEstimated Value: $546,040 - $642,000
4
Beds
3
Baths
2,600
Sq Ft
$230/Sq Ft
Est. Value
About This Home
This home is located at 1594 N Orange St, Riverside, CA 92501 and is currently estimated at $598,260, approximately $230 per square foot. 1594 N Orange St is a home located in Riverside County with nearby schools including Fremont Elementary School, University Heights Middle School, and John W. North High School.
Ownership History
Date
Name
Owned For
Owner Type
Purchase Details
Closed on
Aug 25, 2016
Sold by
Cornejo Jose P and Cornejo Stella A
Bought by
Ghuman Bj Singh and Ghuman Neera K
Current Estimated Value
Home Financials for this Owner
Home Financials are based on the most recent Mortgage that was taken out on this home.
Original Mortgage
$480,000
Outstanding Balance
$383,282
Interest Rate
3.42%
Mortgage Type
Commercial
Estimated Equity
$214,978
Purchase Details
Closed on
Oct 21, 2015
Sold by
Cornejo Jose P and Cornejo Stella A
Bought by
The J & S Cornejo 2015 Family Trust
Purchase Details
Closed on
Mar 27, 2000
Sold by
Snyder Carol A
Bought by
Cornejo Jose P and Cornejo Stella A
Home Financials for this Owner
Home Financials are based on the most recent Mortgage that was taken out on this home.
Original Mortgage
$185,400
Interest Rate
8.18%
Mortgage Type
Commercial
Purchase Details
Closed on
Sep 26, 1995
Sold by
Shober Robert H
Bought by
Torres Jose A
Create a Home Valuation Report for This Property
The Home Valuation Report is an in-depth analysis detailing your home's value as well as a comparison with similar homes in the area
Home Values in the Area
Average Home Value in this Area
Purchase History
| Date | Buyer | Sale Price | Title Company |
|---|---|---|---|
| Ghuman Bj Singh | $640,000 | Ticor Title | |
| The J & S Cornejo 2015 Family Trust | -- | None Available | |
| Cornejo Jose P | $180,000 | First American Title Co | |
| Torres Jose A | -- | -- |
Source: Public Records
Mortgage History
| Date | Status | Borrower | Loan Amount |
|---|---|---|---|
| Open | Ghuman Bj Singh | $480,000 | |
| Previous Owner | Cornejo Jose P | $185,400 |
Source: Public Records
Tax History
| Year | Tax Paid | Tax Assessment Tax Assessment Total Assessment is a certain percentage of the fair market value that is determined by local assessors to be the total taxable value of land and additions on the property. | Land | Improvement |
|---|---|---|---|---|
| 2025 | $3,074 | $280,351 | $26,299 | $254,052 |
| 2023 | $3,074 | $269,467 | $25,279 | $244,188 |
| 2022 | $3,005 | $264,184 | $24,784 | $239,400 |
| 2021 | $7,777 | $686,207 | $214,439 | $471,768 |
| 2020 | $7,719 | $679,172 | $212,241 | $466,931 |
| 2019 | $7,574 | $665,856 | $208,080 | $457,776 |
| 2018 | $7,426 | $652,800 | $204,000 | $448,800 |
| 2017 | $7,295 | $640,000 | $200,000 | $440,000 |
| 2016 | $2,656 | $237,136 | $58,416 | $178,720 |
| 2015 | $2,582 | $230,177 | $57,540 | $172,637 |
| 2014 | $2,558 | $225,670 | $56,414 | $169,256 |
Source: Public Records
Map
Nearby Homes
- 1650 N Orange St
- 3766 Lofton Place
- 1816 Main St
- 3469 Columbia Ave
- 3790 Nuttree Ln
- 1115 Clark St
- 1091 Clark St
- 3528 Russell St
- 1339 Castledale St
- 1762 Park Place Ln
- 1810 Parkplace Ln
- 1959 Thornton St
- 8044 Country Mile Ln
- 1793 Agrigento Ave
- 2443 Wilshire St
- 4063 Honeysuckle St
- 3367 Holding St
- 3858 Carter Ave
- 3943 Ridge Rd
- 4110 Jenkins Ln
Your Personal Tour Guide
Ask me questions while you tour the home.