Estimated Value: $515,000 - $593,000
4
Beds
2
Baths
2,198
Sq Ft
$253/Sq Ft
Est. Value
About This Home
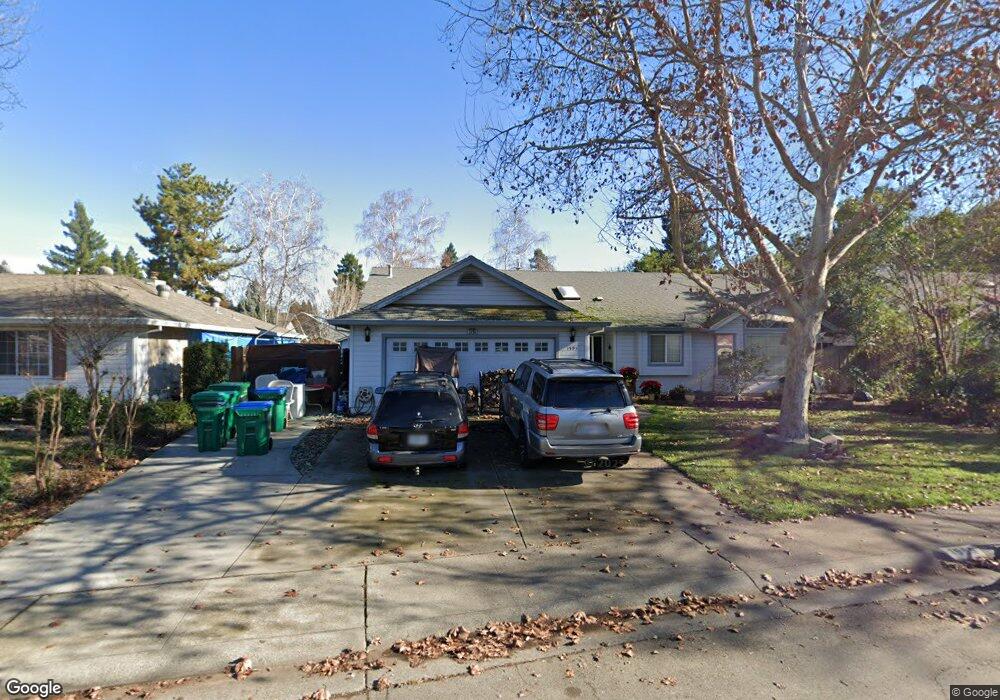
This home is located at 1595 W 8th Ave, Chico, CA 95926 and is currently estimated at $555,190, approximately $252 per square foot. 1595 W 8th Ave is a home located in Butte County with nearby schools including Emma Wilson Elementary School, Chico Junior High School, and Chico High School.
Ownership History
Date
Name
Owned For
Owner Type
Purchase Details
Closed on
Nov 26, 2001
Sold by
Cates David L and Cates Michele C
Bought by
Morrison Kathleen E
Current Estimated Value
Home Financials for this Owner
Home Financials are based on the most recent Mortgage that was taken out on this home.
Original Mortgage
$217,750
Outstanding Balance
$85,465
Interest Rate
6.63%
Estimated Equity
$469,725
Purchase Details
Closed on
Sep 9, 1998
Sold by
Pyshora Leo and Pyshora Marlene L
Bought by
Pyshora Leo and Pyshora Marlene L
Home Financials for this Owner
Home Financials are based on the most recent Mortgage that was taken out on this home.
Original Mortgage
$35,000
Interest Rate
6.89%
Purchase Details
Closed on
Feb 20, 1997
Sold by
Moore Earl J and Moore Jacqueline C
Bought by
Pyshora Leo and Pyshora Marlene L
Create a Home Valuation Report for This Property
The Home Valuation Report is an in-depth analysis detailing your home's value as well as a comparison with similar homes in the area
Purchase History
| Date | Buyer | Sale Price | Title Company |
|---|---|---|---|
| Morrison Kathleen E | $224,500 | Mid Valley Title & Escrow Co | |
| Pyshora Leo | -- | Bidwell Title & Escrow Compa | |
| Pyshora Leo | $179,000 | Fidelity National Title Co |
Source: Public Records
Mortgage History
| Date | Status | Borrower | Loan Amount |
|---|---|---|---|
| Open | Morrison Kathleen E | $217,750 | |
| Previous Owner | Pyshora Leo | $35,000 |
Source: Public Records
Tax History
| Year | Tax Paid | Tax Assessment Tax Assessment Total Assessment is a certain percentage of the fair market value that is determined by local assessors to be the total taxable value of land and additions on the property. | Land | Improvement |
|---|---|---|---|---|
| 2025 | $3,598 | $338,262 | $120,536 | $217,726 |
| 2024 | $3,598 | $331,630 | $118,173 | $213,457 |
| 2023 | $3,554 | $325,128 | $115,856 | $209,272 |
| 2022 | $3,495 | $318,754 | $113,585 | $205,169 |
| 2021 | $3,428 | $312,505 | $111,358 | $201,147 |
| 2020 | $3,418 | $309,302 | $110,217 | $199,085 |
| 2019 | $3,354 | $303,238 | $108,056 | $195,182 |
| 2018 | $3,291 | $297,293 | $105,938 | $191,355 |
| 2017 | $3,223 | $291,464 | $103,861 | $187,603 |
| 2016 | $2,940 | $285,750 | $101,825 | $183,925 |
| 2015 | $2,939 | $281,459 | $100,296 | $181,163 |
| 2014 | $2,867 | $275,947 | $98,332 | $177,615 |
Source: Public Records
Map
Nearby Homes
- 1060 Gateway Ln
- 1041 Raven Ln
- 1025 Raven Ln
- 1395 Nord Ave
- 65 Knightsbridge Ln
- 736 Leafcrest Dr
- 2015 Nord Ave
- 30 Clairidge Ln
- 1044 Southampton Dr
- 30 Fairgate Ln
- 1 4 Acre Ct
- 1122 W Sacramento Ave
- 1110 W 8th Ave Unit 1
- 1110 W 8th Ave Unit 4
- 1114 Nord Ave Unit 29
- 1114 Nord Ave Unit 17
- 2135 Nord Ave Unit 13
- 2135 Nord Ave Unit 7
- 2135 Nord Ave Unit 48
- 2135 Nord Ave Unit 40
- 1583 W 8th Ave
- 1609 W 8th Ave
- 1043 Richland Ct
- 1037 Richland Ct
- 1051 Richland Ct
- 1571 W 8th Ave
- 1623 W 8th Ave
- 1500 Gilbert Ln
- 1501 Gilbert Ln
- 1031 Richland Ct
- 1434 Dartwood Dr
- 1555 W 8th Ave
- 1628 W 8th Ave
- 1504 Gilbert Ln
- 1503 Gilbert Ln
- 1040 Richland Ct
- 1421 Dartwood Dr
- 1428 Dartwood Dr
- 1034 Richland Ct
- 1650 W 8th Ave
Your Personal Tour Guide
Ask me questions while you tour the home.