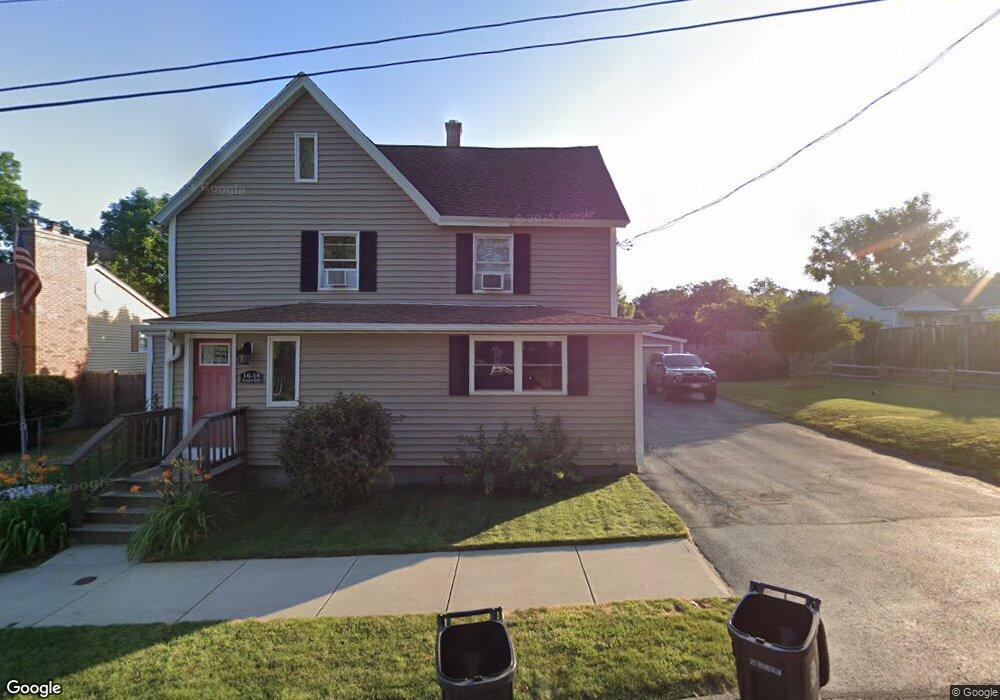
16 Sampson St Chicopee, MA 01020
Chicopee Falls NeighborhoodEstimated Value: $310,032 - $384,000
3
Beds
2
Baths
1,980
Sq Ft
$168/Sq Ft
Est. Value
About This Home
This home is located at 16 Sampson St, Chicopee, MA 01020 and is currently estimated at $333,508, approximately $168 per square foot. 16 Sampson St is a home located in Hampden County with nearby schools including Barry Elementary School, Bellamy Middle School, and Chicopee Comprehensive High School.
Ownership History
Date
Name
Owned For
Owner Type
Purchase Details
Closed on
Nov 4, 2003
Sold by
Walczak David T
Bought by
Makos Steven M
Current Estimated Value
Home Financials for this Owner
Home Financials are based on the most recent Mortgage that was taken out on this home.
Original Mortgage
$105,000
Outstanding Balance
$48,847
Interest Rate
6.05%
Mortgage Type
Purchase Money Mortgage
Estimated Equity
$284,661
Create a Home Valuation Report for This Property
The Home Valuation Report is an in-depth analysis detailing your home's value as well as a comparison with similar homes in the area
Home Values in the Area
Average Home Value in this Area
Purchase History
| Date | Buyer | Sale Price | Title Company |
|---|---|---|---|
| Makos Steven M | $120,000 | -- |
Source: Public Records
Mortgage History
| Date | Status | Borrower | Loan Amount |
|---|---|---|---|
| Open | Makos Steven M | $105,000 |
Source: Public Records
Tax History
| Year | Tax Paid | Tax Assessment Tax Assessment Total Assessment is a certain percentage of the fair market value that is determined by local assessors to be the total taxable value of land and additions on the property. | Land | Improvement |
|---|---|---|---|---|
| 2025 | $4,114 | $271,400 | $112,100 | $159,300 |
| 2024 | $3,901 | $264,300 | $109,900 | $154,400 |
| 2023 | $3,647 | $240,700 | $99,800 | $140,900 |
| 2022 | $3,576 | $210,500 | $86,800 | $123,700 |
| 2021 | $3,393 | $192,700 | $78,900 | $113,800 |
| 2020 | $3,225 | $184,700 | $78,200 | $106,500 |
| 2019 | $3,184 | $177,300 | $78,200 | $99,100 |
| 2018 | $3,111 | $169,900 | $74,500 | $95,400 |
| 2017 | $2,785 | $160,900 | $68,400 | $92,500 |
| 2016 | $2,574 | $152,200 | $68,400 | $83,800 |
| 2015 | $2,589 | $147,600 | $68,400 | $79,200 |
| 2014 | $1,294 | $147,600 | $68,400 | $79,200 |
Source: Public Records
Map
Nearby Homes
- 23 Jackson St
- 57 Colonial Cir Unit D
- 41 Oakhill Cir Unit 41
- 251 Fuller Rd
- 461 Sheridan St
- 238 E Main St
- 23 Sterling St
- 55 Fuller St
- 156 East St
- 30 Butler Ave
- 45 Hastings St
- 1150 Granby Rd
- 130 Celebration Cir
- 107 Beauregard Terrace
- 141 Edbert St
- 33 Washington St
- 11 Gala Way
- 1246 Granby Rd Unit 66
- 104 Madison St
- 111 Festival Cir
Your Personal Tour Guide
Ask me questions while you tour the home.