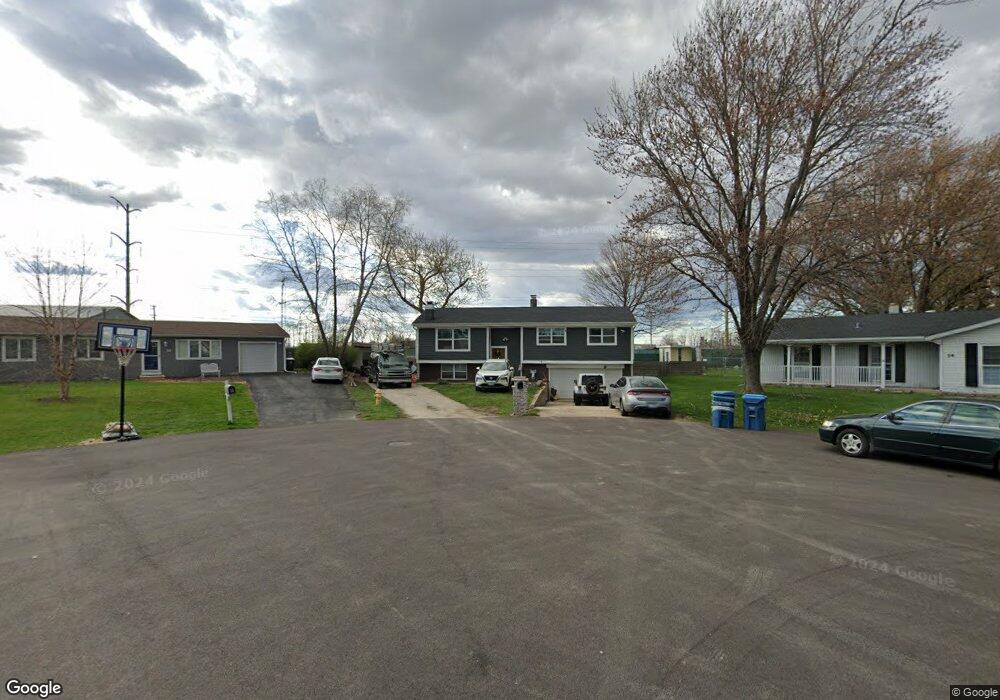
16 Shell Ct Oswego, IL 60543
Northwest Oswego NeighborhoodEstimated Value: $263,000 - $306,327
4
Beds
2
Baths
1,300
Sq Ft
$217/Sq Ft
Est. Value
About This Home
This home is located at 16 Shell Ct, Oswego, IL 60543 and is currently estimated at $281,832, approximately $216 per square foot. 16 Shell Ct is a home located in Kendall County with nearby schools including Fox Chase Elementary School, Traughber Junior High School, and Oswego High School.
Ownership History
Date
Name
Owned For
Owner Type
Purchase Details
Closed on
Jan 25, 2017
Sold by
Mohammed Saleem
Bought by
Medina Patricia
Current Estimated Value
Home Financials for this Owner
Home Financials are based on the most recent Mortgage that was taken out on this home.
Original Mortgage
$145,403
Outstanding Balance
$121,385
Interest Rate
4.5%
Mortgage Type
New Conventional
Estimated Equity
$160,447
Purchase Details
Closed on
May 27, 2016
Sold by
Canup Daniel L and Canup Audrey
Bought by
Federal National Mortgage Association
Purchase Details
Closed on
Nov 13, 2012
Sold by
Canup Audrey A
Bought by
Canup Daniel L
Purchase Details
Closed on
Nov 10, 1999
Sold by
Canup Joe M
Bought by
Canup Audrey A
Home Financials for this Owner
Home Financials are based on the most recent Mortgage that was taken out on this home.
Original Mortgage
$28,000
Interest Rate
7.76%
Create a Home Valuation Report for This Property
The Home Valuation Report is an in-depth analysis detailing your home's value as well as a comparison with similar homes in the area
Home Values in the Area
Average Home Value in this Area
Purchase History
| Date | Buyer | Sale Price | Title Company |
|---|---|---|---|
| Medina Patricia | $150,000 | Attorneys Title Guaranty Fun | |
| Federal National Mortgage Association | -- | None Available | |
| Canup Daniel L | -- | None Available | |
| Canup Audrey A | -- | Law Title Ins Co |
Source: Public Records
Mortgage History
| Date | Status | Borrower | Loan Amount |
|---|---|---|---|
| Open | Medina Patricia | $145,403 | |
| Previous Owner | Canup Audrey A | $28,000 |
Source: Public Records
Tax History
| Year | Tax Paid | Tax Assessment Tax Assessment Total Assessment is a certain percentage of the fair market value that is determined by local assessors to be the total taxable value of land and additions on the property. | Land | Improvement |
|---|---|---|---|---|
| 2024 | $6,186 | $84,146 | $18,498 | $65,648 |
| 2023 | $5,761 | $75,807 | $16,665 | $59,142 |
| 2022 | $5,761 | $70,848 | $15,575 | $55,273 |
| 2021 | $5,377 | $64,407 | $14,159 | $50,248 |
| 2020 | $4,987 | $59,636 | $13,110 | $46,526 |
| 2019 | $4,704 | $55,795 | $13,110 | $42,685 |
| 2018 | $4,651 | $51,662 | $12,139 | $39,523 |
| 2017 | $4,808 | $47,615 | $11,188 | $36,427 |
| 2016 | $4,625 | $45,133 | $10,605 | $34,528 |
| 2015 | $4,578 | $42,579 | $10,005 | $32,574 |
| 2014 | -- | $40,169 | $9,439 | $30,730 |
| 2013 | -- | $40,574 | $9,534 | $31,040 |
Source: Public Records
Map
Nearby Homes
- 2800 Light Rd Unit 102
- 7.43 Acres Vacant La State Route 31
- 2600 Light Rd Unit 210
- 2600 Light Rd Unit 207
- 5.43 B-3 Commercial State Route 31
- 1900 Light Rd Unit 208
- 2300 Light Rd Unit 209
- 1415 State Route 31
- 404 Beaver Ct Unit 3
- 435 Fawn Dr
- 116 River Mist Dr
- 119 Garden Dr
- 149 Willowwood Dr N
- 133 River Mist Dr Unit 3
- 135 River Mist Dr Unit 2
- 9 Cebold Dr
- 431 Badger Ln
- 117 Boulder Hill Pass Unit 117
- 2110 State Route 31
- 316 Ash Grove Ln
Your Personal Tour Guide
Ask me questions while you tour the home.