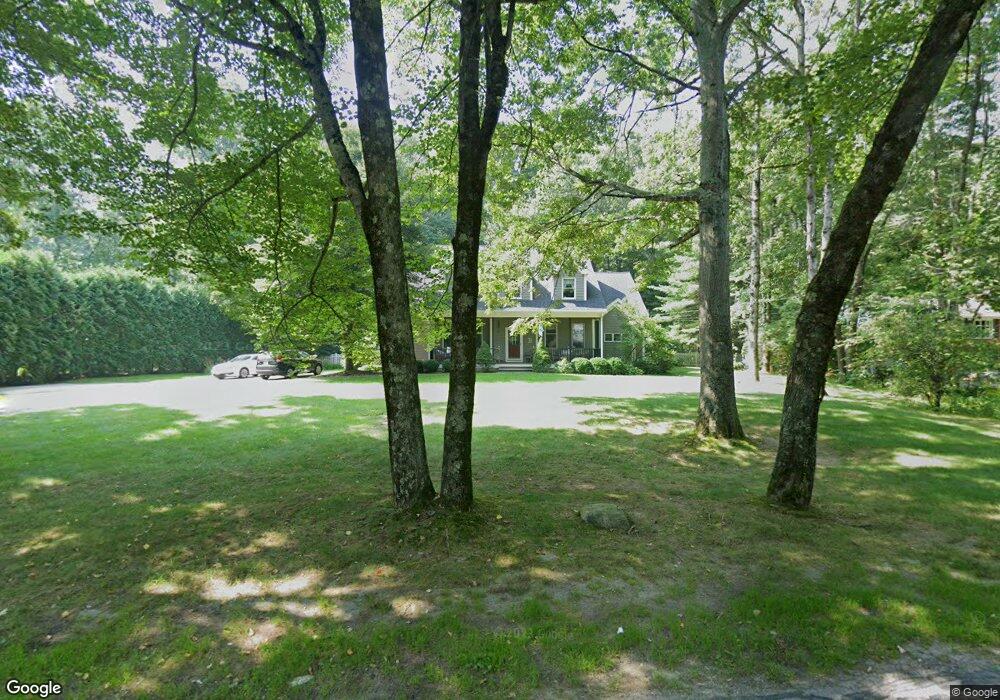
160 Beech St Franklin, MA 02038
Estimated Value: $851,179 - $1,124,000
6
Beds
3
Baths
3,436
Sq Ft
$288/Sq Ft
Est. Value
About This Home
This home is located at 160 Beech St, Franklin, MA 02038 and is currently estimated at $988,045, approximately $287 per square foot. 160 Beech St is a home located in Norfolk County with nearby schools including John F. Kennedy Memorial School, Horace Mann Middle School, and Franklin High School.
Ownership History
Date
Name
Owned For
Owner Type
Purchase Details
Closed on
Feb 15, 2002
Sold by
Batista Joao B and Batista Kristin
Bought by
Digiacomo Stephen M and Digiacomo Blanca I
Current Estimated Value
Home Financials for this Owner
Home Financials are based on the most recent Mortgage that was taken out on this home.
Original Mortgage
$300,000
Outstanding Balance
$124,748
Interest Rate
7.14%
Mortgage Type
Purchase Money Mortgage
Estimated Equity
$863,297
Create a Home Valuation Report for This Property
The Home Valuation Report is an in-depth analysis detailing your home's value as well as a comparison with similar homes in the area
Purchase History
| Date | Buyer | Sale Price | Title Company |
|---|---|---|---|
| Digiacomo Stephen M | $415,000 | -- |
Source: Public Records
Mortgage History
| Date | Status | Borrower | Loan Amount |
|---|---|---|---|
| Open | Digiacomo Stephen M | $300,000 |
Source: Public Records
Tax History
| Year | Tax Paid | Tax Assessment Tax Assessment Total Assessment is a certain percentage of the fair market value that is determined by local assessors to be the total taxable value of land and additions on the property. | Land | Improvement |
|---|---|---|---|---|
| 2025 | $7,360 | $633,400 | $246,700 | $386,700 |
| 2024 | $6,466 | $548,400 | $246,700 | $301,700 |
| 2023 | $6,578 | $522,900 | $248,700 | $274,200 |
| 2022 | $6,266 | $446,000 | $205,600 | $240,400 |
| 2021 | $6,575 | $448,800 | $220,200 | $228,600 |
| 2020 | $6,373 | $439,200 | $222,100 | $217,100 |
| 2019 | $6,132 | $418,300 | $201,200 | $217,100 |
| 2018 | $5,864 | $400,300 | $206,900 | $193,400 |
| 2017 | $5,587 | $383,200 | $189,800 | $193,400 |
| 2016 | $5,540 | $382,100 | $186,800 | $195,300 |
| 2015 | $5,602 | $377,500 | $182,200 | $195,300 |
| 2014 | $5,034 | $348,400 | $153,100 | $195,300 |
Source: Public Records
Map
Nearby Homes