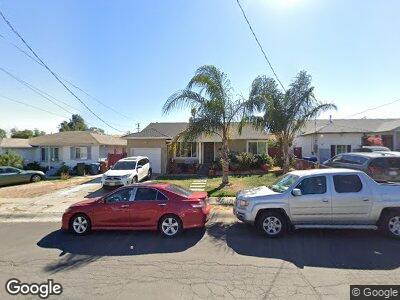
160 Hill St Bay Point, CA 94565
Bay Point West NeighborhoodEstimated Value: $432,447 - $578,000
3
Beds
1
Bath
1,233
Sq Ft
$382/Sq Ft
Est. Value
About This Home
This home is located at 160 Hill St, Bay Point, CA 94565 and is currently estimated at $471,612, approximately $382 per square foot. 160 Hill St is a home located in Contra Costa County with nearby schools including Bel Air Elementary School, Riverview Middle School, and Mt. Diablo High School.
Ownership History
Date
Name
Owned For
Owner Type
Purchase Details
Closed on
Jun 26, 2013
Sold by
Hooper Sharon A and Walker Virginia Anne
Bought by
Nieves Sandra J
Current Estimated Value
Home Financials for this Owner
Home Financials are based on the most recent Mortgage that was taken out on this home.
Original Mortgage
$121,500
Interest Rate
3.48%
Mortgage Type
New Conventional
Purchase Details
Closed on
May 6, 2005
Sold by
Ohara Patrick J
Bought by
Hooper Sharon A and Walker Virginia Anne
Home Financials for this Owner
Home Financials are based on the most recent Mortgage that was taken out on this home.
Original Mortgage
$61,400
Interest Rate
5.87%
Mortgage Type
Unknown
Purchase Details
Closed on
Jun 23, 2004
Sold by
Ohara Eileen
Bought by
Ohara Eileen
Purchase Details
Closed on
May 28, 1996
Sold by
Ohara Robert E and Eileen Ohara E
Bought by
Ohara Robert E and Ohara Eileen
Create a Home Valuation Report for This Property
The Home Valuation Report is an in-depth analysis detailing your home's value as well as a comparison with similar homes in the area
Home Values in the Area
Average Home Value in this Area
Purchase History
| Date | Buyer | Sale Price | Title Company |
|---|---|---|---|
| Nieves Sandra J | $135,000 | North American Title Company | |
| Nieves Sandra J | -- | North American Title Company | |
| Hooper Sharon A | $307,000 | Placer Title | |
| Ohara Eileen | -- | -- | |
| Ohara Robert E | -- | -- |
Source: Public Records
Mortgage History
| Date | Status | Borrower | Loan Amount |
|---|---|---|---|
| Open | Nieves Sandra J | $115,000 | |
| Closed | Nieves Sandra J | $121,500 | |
| Previous Owner | Hooper Sharon A | $335,000 | |
| Previous Owner | Hooper Sharon A | $34,000 | |
| Previous Owner | Hooper Sharon A | $360,000 | |
| Previous Owner | Hooper Sharon A | $61,400 | |
| Previous Owner | Hooper Sharon A | $245,600 |
Source: Public Records
Tax History Compared to Growth
Tax History
| Year | Tax Paid | Tax Assessment Tax Assessment Total Assessment is a certain percentage of the fair market value that is determined by local assessors to be the total taxable value of land and additions on the property. | Land | Improvement |
|---|---|---|---|---|
| 2024 | $2,614 | $174,285 | $120,724 | $53,561 |
| 2023 | $2,614 | $170,868 | $118,357 | $52,511 |
| 2022 | $2,597 | $167,519 | $116,037 | $51,482 |
| 2021 | $2,532 | $164,235 | $113,762 | $50,473 |
| 2019 | $2,452 | $159,366 | $110,389 | $48,977 |
| 2018 | $2,372 | $156,242 | $108,225 | $48,017 |
| 2017 | $2,296 | $153,179 | $106,103 | $47,076 |
| 2016 | $2,220 | $150,176 | $104,023 | $46,153 |
| 2015 | $2,189 | $147,921 | $102,461 | $45,460 |
| 2014 | $2,040 | $135,612 | $100,454 | $35,158 |
Source: Public Records
Map
Nearby Homes
- 46 Virginia Dr
- 34 Fern Ln
- 107 Marys Ave
- 41 Bright Ln
- 1383 Sanctuary St
- 3 Cedar Ct
- 8 Lancaster Cir Unit 118
- 515 Lancaster Ln Unit 236
- 515 Lancaster Ln Unit 140
- 2867 Willow Pass Rd
- 2881 Clearland Cir
- 1093 Chadwick Cir
- 3 Lancaster Cir Unit 109
- 3777 Willow Pass Rd Unit 30
- 3777 Willow Pass Rd Unit 54
- 210 Amerson Ave
- 461 Virgil St
- 5 Live Oak Ct
- 2205 Botany Bay Dr
- 220 Riverside Place