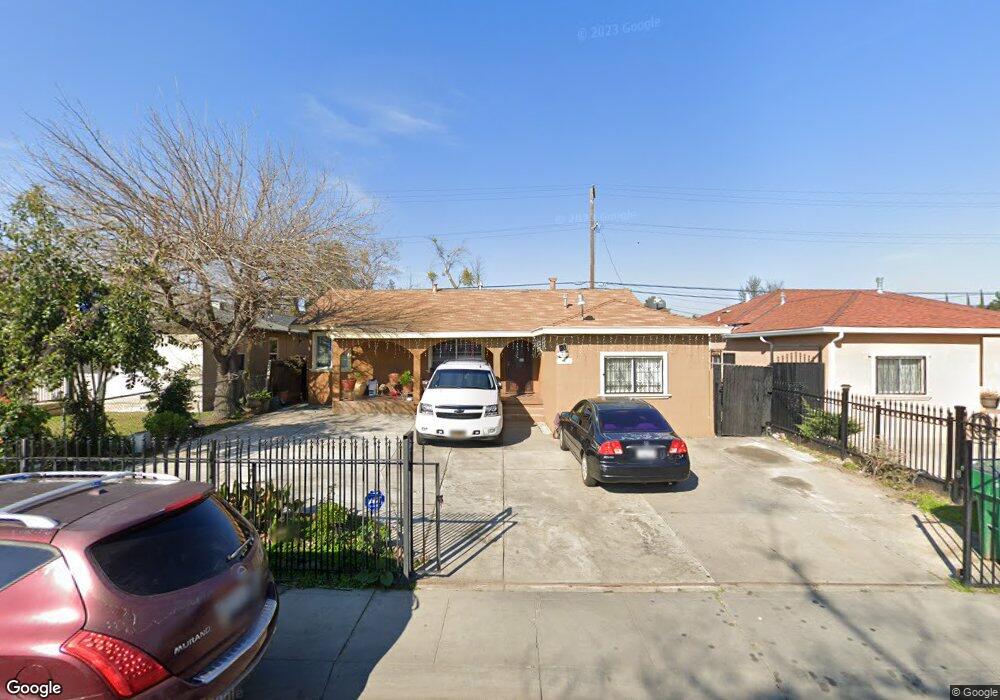
1601 E 7th St Stockton, CA 95206
Kennedy NeighborhoodEstimated Value: $253,000 - $322,000
3
Beds
1
Bath
986
Sq Ft
$300/Sq Ft
Est. Value
About This Home
This home is located at 1601 E 7th St, Stockton, CA 95206 and is currently estimated at $295,310, approximately $299 per square foot. 1601 E 7th St is a home located in San Joaquin County with nearby schools including Van Buren Elementary School, Alexander Hamilton Elementary, and Monroe Elementary School.
Ownership History
Date
Name
Owned For
Owner Type
Purchase Details
Closed on
Jul 20, 2005
Sold by
Orejel Jose and Orejel Maria
Bought by
Orejel Jose and Orejel Maria
Current Estimated Value
Home Financials for this Owner
Home Financials are based on the most recent Mortgage that was taken out on this home.
Original Mortgage
$140,000
Outstanding Balance
$76,541
Interest Rate
6.4%
Mortgage Type
Purchase Money Mortgage
Estimated Equity
$218,769
Purchase Details
Closed on
Jun 5, 1998
Sold by
Esquivel Javier F and Esquivel Modesta
Bought by
Orejel Jose and Orejel Maria
Home Financials for this Owner
Home Financials are based on the most recent Mortgage that was taken out on this home.
Original Mortgage
$51,300
Interest Rate
7.17%
Purchase Details
Closed on
May 5, 1997
Sold by
Brown Hannah
Bought by
Esquivel Javier F and Esquivel Modesta
Purchase Details
Closed on
Nov 13, 1995
Sold by
Fleming Elizabeth B
Bought by
Fleming Elizabeth B and Brown Hannah
Create a Home Valuation Report for This Property
The Home Valuation Report is an in-depth analysis detailing your home's value as well as a comparison with similar homes in the area
Home Values in the Area
Average Home Value in this Area
Purchase History
| Date | Buyer | Sale Price | Title Company |
|---|---|---|---|
| Orejel Jose | -- | -- | |
| Orejel Jose | -- | Placer Title Company | |
| Orejel Jose | $54,000 | Old Republic Title Company | |
| Esquivel Javier F | $35,000 | Old Republic Title Company | |
| Fleming Elizabeth B | -- | -- |
Source: Public Records
Mortgage History
| Date | Status | Borrower | Loan Amount |
|---|---|---|---|
| Open | Orejel Jose | $140,000 | |
| Closed | Orejel Jose | $51,300 |
Source: Public Records
Tax History
| Year | Tax Paid | Tax Assessment Tax Assessment Total Assessment is a certain percentage of the fair market value that is determined by local assessors to be the total taxable value of land and additions on the property. | Land | Improvement |
|---|---|---|---|---|
| 2025 | $1,081 | $86,213 | $15,964 | $70,249 |
| 2024 | $1,063 | $84,523 | $15,651 | $68,872 |
| 2023 | $1,040 | $82,867 | $15,345 | $67,522 |
| 2022 | $1,031 | $81,244 | $15,045 | $66,199 |
| 2021 | $991 | $79,651 | $14,750 | $64,901 |
| 2020 | $1,010 | $78,835 | $14,599 | $64,236 |
| 2019 | $1,005 | $77,290 | $14,313 | $62,977 |
| 2018 | $987 | $75,776 | $14,033 | $61,743 |
| 2017 | $936 | $74,291 | $13,758 | $60,533 |
| 2016 | $952 | $72,835 | $13,488 | $59,347 |
| 2015 | $952 | $71,740 | $13,285 | $58,455 |
| 2014 | $907 | $70,335 | $13,025 | $57,310 |
Source: Public Records
Map
Nearby Homes
- 2121 Scribner St
- 1430 E 7th St
- 1105 E 7th St
- 2319 S Union St
- 2032 E 9th St
- 2615 Cerruti St
- 2052 E 4th St
- 2343 S Sacramento St
- 2511 S Laurel St
- 822 E 4th St
- 3011 Anne St
- 2020 S American St
- 739 E 2nd St
- 1615 S Stanislaus St
- 1636 E Anderson St
- 421 E 8th St
- 3260 Belleview Ave
- 1827 S California St
- 1954 S Sutter St
- 2258 E Loomis Rd
Your Personal Tour Guide
Ask me questions while you tour the home.