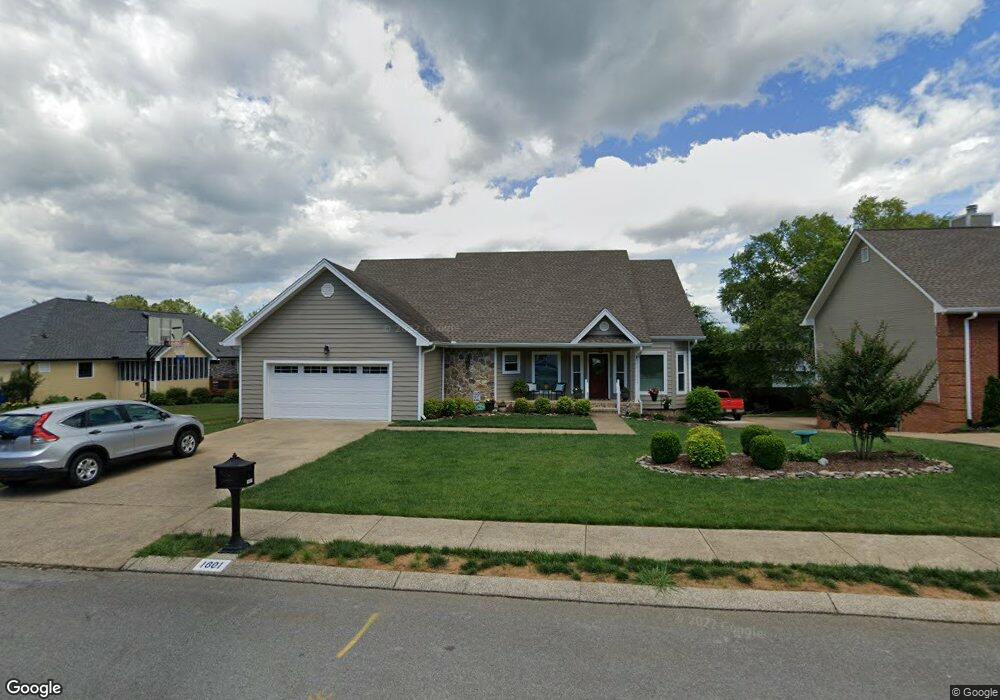
1601 Foxhall Ln Chattanooga, TN 37421
Westview-Mountain Shadows NeighborhoodEstimated Value: $371,000 - $426,000
3
Beds
2
Baths
2,210
Sq Ft
$181/Sq Ft
Est. Value
About This Home
This home is located at 1601 Foxhall Ln, Chattanooga, TN 37421 and is currently estimated at $400,909, approximately $181 per square foot. 1601 Foxhall Ln is a home located in Hamilton County with nearby schools including Westview Elementary School, East Hamilton Middle School, and East Hamilton School.
Ownership History
Date
Name
Owned For
Owner Type
Purchase Details
Closed on
Jul 30, 2019
Sold by
Loftin John M
Bought by
Loftin Mary R
Current Estimated Value
Home Financials for this Owner
Home Financials are based on the most recent Mortgage that was taken out on this home.
Original Mortgage
$142,000
Outstanding Balance
$93,674
Interest Rate
3.7%
Mortgage Type
New Conventional
Estimated Equity
$307,235
Purchase Details
Closed on
Oct 30, 2001
Sold by
Vanleigh Lavera H
Bought by
Loftin John M and Loftin Mary R
Home Financials for this Owner
Home Financials are based on the most recent Mortgage that was taken out on this home.
Original Mortgage
$142,500
Interest Rate
6.67%
Mortgage Type
Purchase Money Mortgage
Purchase Details
Closed on
May 10, 2000
Sold by
Twomey Robert G and Twomey Miriam B
Bought by
Vanleigh Logan and Vanleigh Lavera H
Purchase Details
Closed on
Dec 29, 1995
Sold by
Deems Walter L
Bought by
Twomey Robert G and Twomey Miria
Purchase Details
Closed on
Jun 23, 1995
Sold by
Larry Akins
Bought by
Deems Walter L
Create a Home Valuation Report for This Property
The Home Valuation Report is an in-depth analysis detailing your home's value as well as a comparison with similar homes in the area
Home Values in the Area
Average Home Value in this Area
Purchase History
| Date | Buyer | Sale Price | Title Company |
|---|---|---|---|
| Loftin Mary R | -- | Pioneer Title Ins Agcy Inc | |
| Loftin John M | $150,000 | -- | |
| Vanleigh Logan | $142,000 | Northgate Title Escrow Inc | |
| Twomey Robert G | $132,900 | -- | |
| Deems Walter L | $123,000 | -- |
Source: Public Records
Mortgage History
| Date | Status | Borrower | Loan Amount |
|---|---|---|---|
| Open | Loftin Mary R | $142,000 | |
| Closed | Loftin John M | $142,500 |
Source: Public Records
Tax History Compared to Growth
Tax History
| Year | Tax Paid | Tax Assessment Tax Assessment Total Assessment is a certain percentage of the fair market value that is determined by local assessors to be the total taxable value of land and additions on the property. | Land | Improvement |
|---|---|---|---|---|
| 2024 | $1,402 | $62,650 | $0 | $0 |
| 2023 | $1,402 | $62,650 | $0 | $0 |
| 2022 | $1,402 | $62,650 | $0 | $0 |
| 2021 | $1,402 | $62,650 | $0 | $0 |
| 2020 | $1,432 | $51,800 | $0 | $0 |
| 2019 | $1,432 | $51,800 | $0 | $0 |
| 2018 | $1,306 | $51,800 | $0 | $0 |
| 2017 | $1,432 | $51,800 | $0 | $0 |
| 2016 | $1,358 | $0 | $0 | $0 |
| 2015 | $2,607 | $49,100 | $0 | $0 |
| 2014 | $2,607 | $0 | $0 | $0 |
Source: Public Records
Map
Nearby Homes
- 8628 Georgetown Ln
- 1669 Morris Hill Rd
- 8610 Georgetown Trace Ln
- 8931 E Brainerd Rd
- 9096 E Brainerd Rd
- 8827 E Brainerd Rd
- 1344 Springview Dr
- 109 Brently Woods Dr
- 1755 Stones Rest Cir
- 9924 Brently Estates Dr
- 1211 Springview Dr
- 8676 Masons Gate Ln
- 2612 Banks Rd
- 1830 Lela Ln
- 0 Julian Ridge Rd Unit RTC2616606
- 0 Julian Ridge Rd Unit 1386260
- 1748 Andover Place
- 401 Cyndica Dr
- 1783 Andover Place
- 1109 Maple Tree Ln
- 1603 Foxhall Ln
- 8709 Georgetown Trace Ln
- 0 Foxhall Ln
- 8701 Georgetown Trace Ln
- 8705 Georgetown Trace Ln
- 8627 Georgetown Trace Ln
- 8619 Georgetown Trace Ln
- 8715 Georgetown Trace Ln
- 1602 Foxhall Ln
- 8623 Georgetown Trace Ln
- 1604 Foxhall Ln
- 8615 Georgetown Trace Ln
- 8717 Georgetown Trace Ln
- 8710 Georgetown Trace Ln
- 8712 Georgetown Trace Ln
- 8708 Georgetown Trace Ln
- 8702 Georgetown Trace Ln
- 8630 Georgetown Trace Ln
- 8714 Georgetown Trace Ln
- 8613 Georgetown Trace Ln