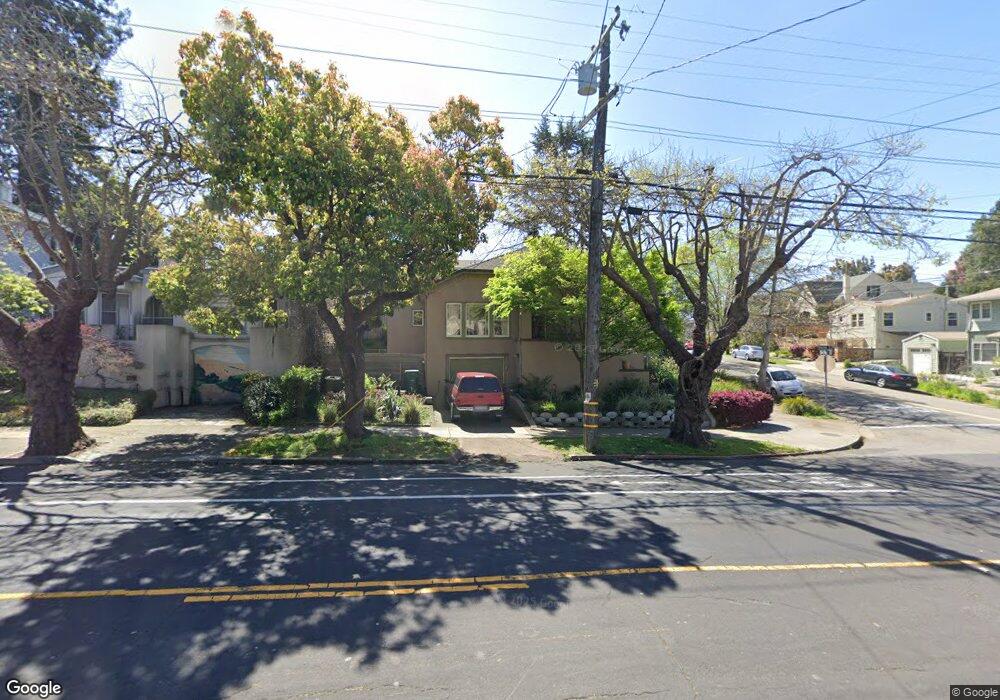
1602 Marin Ave Albany, CA 94707
Albany Terrace NeighborhoodEstimated Value: $1,297,000 - $1,706,000
3
Beds
3
Baths
1,701
Sq Ft
$906/Sq Ft
Est. Value
About This Home
This home is located at 1602 Marin Ave, Albany, CA 94707 and is currently estimated at $1,540,832, approximately $905 per square foot. 1602 Marin Ave is a home located in Alameda County with nearby schools including Albany Middle School, Albany High School, and The Crowden School.
Ownership History
Date
Name
Owned For
Owner Type
Purchase Details
Closed on
Feb 9, 1998
Sold by
Masterson Richard I and Dove Debra L
Bought by
Madson David J and Demichiel Helen
Current Estimated Value
Home Financials for this Owner
Home Financials are based on the most recent Mortgage that was taken out on this home.
Original Mortgage
$244,800
Outstanding Balance
$43,259
Interest Rate
6.98%
Estimated Equity
$1,497,573
Create a Home Valuation Report for This Property
The Home Valuation Report is an in-depth analysis detailing your home's value as well as a comparison with similar homes in the area
Home Values in the Area
Average Home Value in this Area
Purchase History
| Date | Buyer | Sale Price | Title Company |
|---|---|---|---|
| Madson David J | $306,000 | Old Republic Title Company |
Source: Public Records
Mortgage History
| Date | Status | Borrower | Loan Amount |
|---|---|---|---|
| Open | Madson David J | $244,800 |
Source: Public Records
Tax History
| Year | Tax Paid | Tax Assessment Tax Assessment Total Assessment is a certain percentage of the fair market value that is determined by local assessors to be the total taxable value of land and additions on the property. | Land | Improvement |
|---|---|---|---|---|
| 2025 | $9,813 | $481,580 | $146,574 | $342,006 |
| 2024 | $9,813 | $472,002 | $143,700 | $335,302 |
| 2023 | $9,236 | $469,611 | $140,883 | $328,728 |
| 2022 | $8,838 | $453,404 | $138,121 | $322,283 |
| 2021 | $8,701 | $444,377 | $135,413 | $315,964 |
| 2020 | $8,551 | $446,750 | $134,025 | $312,725 |
| 2019 | $8,358 | $437,992 | $131,397 | $306,595 |
| 2018 | $8,128 | $429,406 | $128,822 | $300,584 |
| 2017 | $7,923 | $420,988 | $126,296 | $294,692 |
| 2016 | $7,551 | $412,735 | $123,820 | $288,915 |
| 2015 | $7,094 | $406,535 | $121,960 | $284,575 |
| 2014 | $6,987 | $398,573 | $119,572 | $279,001 |
Source: Public Records
Map
Nearby Homes
- 1066 Peralta Ave
- 1127 Key Route Blvd
- 938 Masonic Ave
- 1563 Thousand Oaks Blvd
- 1529 Ada St
- 840 Key Route Blvd
- 820 Key Route Blvd
- 1983 Yosemite Rd
- 1266 Washington Ave
- 720 Key Route Blvd
- 1207 Cornell Ave
- 1259 Portland Ave
- 826 Indian Rock Ave
- 986 Kains Ave
- 1815 Vine St
- 1425 Martin Luther King jr Way
- 946 Kains Ave
- 1234 Stannage Ave
- 606 Masonic Ave
- 1400 Santa fe Ave
Your Personal Tour Guide
Ask me questions while you tour the home.