948 Ordway St Albany, CA 94706
Albany Terrace NeighborhoodEstimated Value: $922,000 - $1,188,000
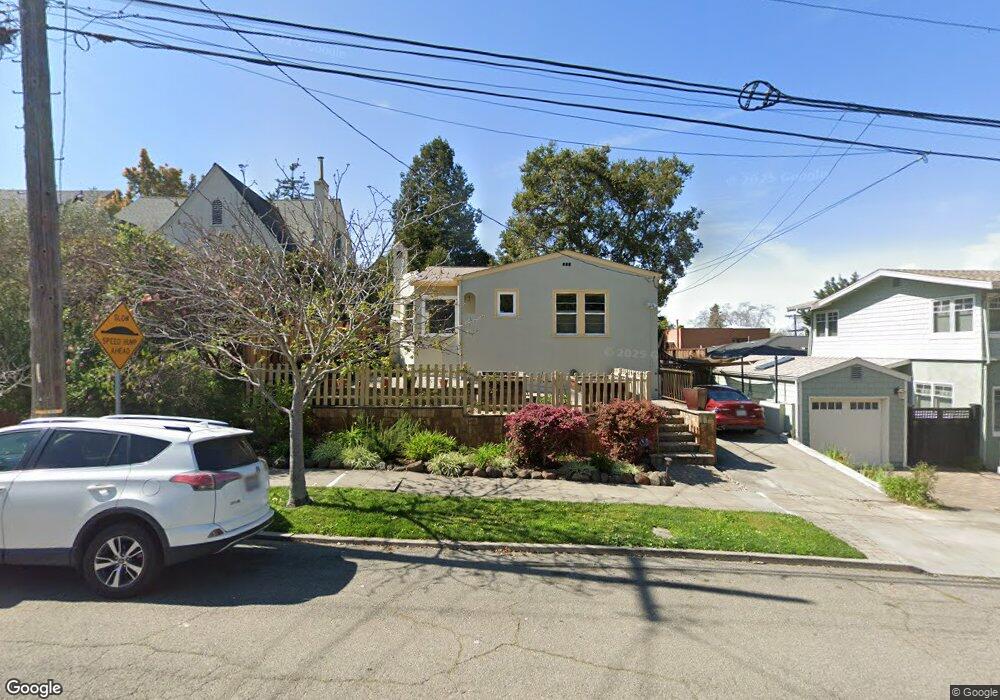
About This Home
This home is located at 948 Ordway St, Albany, CA 94706 and is currently estimated at $1,088,572, approximately $1,294 per square foot. 948 Ordway St is a home located in Alameda County with nearby schools including Albany Middle School, Albany High School, and The Crowden School.
Ownership History
We collect this data history from publicly available records. To have your information removed, we recommend requesting removal directly through your county’s website.
Purchase Details
Home Financials for this Owner
Home Financials are based on the most recent Mortgage that was taken out on this home.Purchase Details
Home Financials for this Owner
Home Financials are based on the most recent Mortgage that was taken out on this home.Purchase Details
Purchase Details
Home Financials for this Owner
Home Financials are based on the most recent Mortgage that was taken out on this home.Purchase Details
Purchase Details
Purchase Details
Purchase Details
Purchase Details
Home Financials for this Owner
Home Financials are based on the most recent Mortgage that was taken out on this home.Purchase Details
Home Financials for this Owner
Home Financials are based on the most recent Mortgage that was taken out on this home.Purchase Details
Purchase Details
Home Financials for this Owner
Home Financials are based on the most recent Mortgage that was taken out on this home.Purchase Details
Home Financials for this Owner
Home Financials are based on the most recent Mortgage that was taken out on this home.Purchase Details
Home Financials for this Owner
Home Financials are based on the most recent Mortgage that was taken out on this home.Purchase Details
Purchase Details
Home Financials for this Owner
Home Financials are based on the most recent Mortgage that was taken out on this home.Home Values in the Area
Average Home Value in this Area
Purchase History
We collect this data history from publicly available records. To have your information removed, we recommend requesting removal directly through your county’s website.
| Date | Buyer | Sale Price | Title Company |
|---|---|---|---|
| -- | Chicago Title Company | ||
| -- | Chicago Title Company | ||
| -- | Chicago Title Company | ||
| -- | Chicago Title Company | ||
| -- | None Available | ||
| $490,000 | Placer Title Company | ||
| -- | None Available | ||
| $490,000 | First American Title Co | ||
| $575,000 | Accommodation | ||
| $74,911 | Lawyers Title Company | ||
| $680,000 | Alliance Title Company | ||
| $630,000 | First American Title Co | ||
| -- | -- | ||
| $425,000 | First California Title Compa | ||
| $339,000 | Old Republic Title Company | ||
| $235,000 | First American Title Guarant | ||
| -- | -- | ||
| $88,000 | Old Republic Title Company |
Mortgage History
We collect this data history from publicly available records. To have your information removed, we recommend requesting removal directly through your county’s website.
| Date | Status | Borrower | Loan Amount |
|---|---|---|---|
| Open | $430,000 | ||
| Closed | $400,000 | ||
| Closed | $392,000 | ||
| Previous Owner | $500,000 | ||
| Previous Owner | $504,000 | ||
| Previous Owner | $300,700 | ||
| Previous Owner | $271,200 | ||
| Previous Owner | $176,250 | ||
| Previous Owner | $54,400 | ||
| Closed | $140,000 | ||
| Closed | $50,800 | ||
| Closed | $81,750 |
Tax History
We collect this data history from publicly available records. To have your information removed, we recommend requesting removal directly through your county’s website.
| Year | Tax Paid | Tax Assessment Tax Assessment Total Assessment is a certain percentage of the fair market value that is determined by local assessors to be the total taxable value of land and additions on the property. | Land | Improvement |
|---|---|---|---|---|
| 2025 | $10,096 | $625,457 | $189,737 | $442,720 |
| 2024 | $10,096 | $613,060 | $186,018 | $434,042 |
| 2023 | $9,940 | $607,903 | $182,371 | $425,532 |
| 2022 | $9,615 | $588,986 | $178,796 | $417,190 |
| 2021 | $10,521 | $577,304 | $175,291 | $409,013 |
| 2020 | $10,377 | $578,317 | $173,495 | $404,822 |
| 2019 | $10,145 | $566,978 | $170,093 | $396,885 |
| 2018 | $9,862 | $555,865 | $166,759 | $389,106 |
| 2017 | $9,616 | $544,967 | $163,490 | $381,477 |
| 2016 | $9,171 | $534,285 | $160,285 | $374,000 |
| 2015 | $8,582 | $526,264 | $157,879 | $368,385 |
| 2014 | $8,482 | $515,960 | $154,788 | $361,172 |
Map
- 1021 Colusa Ave
- 1036 Ramona Ave
- 762 Neilson St
- 1035 Pomona Ave
- 1009 Key Route Blvd
- 1310 Carlotta Ave
- 1515 Hopkins St Unit 5
- 1120 Masonic Ave
- 1034 Evelyn Ave
- 840 Key Route Blvd
- 1611 Rose St
- 1313 Curtis St
- 1418 #2 Northside Ave
- 515 Vincente Ave
- 415 Berkeley Park Blvd
- 986 Kains Ave
- 848 Stannage Ave Unit 11
- 1192 Kains Ave
- 1419 Northside Ave Unit B
- 813 San Diego Rd
Ask me questions while you tour the home.